
south
import sys
import os
sys.path.append(os.path.abspath('..'))
import mapclassify as mc
import libpysal
import geopandas as gpd
import matplotlib.pyplot as plt

%matplotlib inline
_ = libpysal.examples.load_example('South')
df = gpd.read_file(libpysal.examples.get_path('south.shp'))
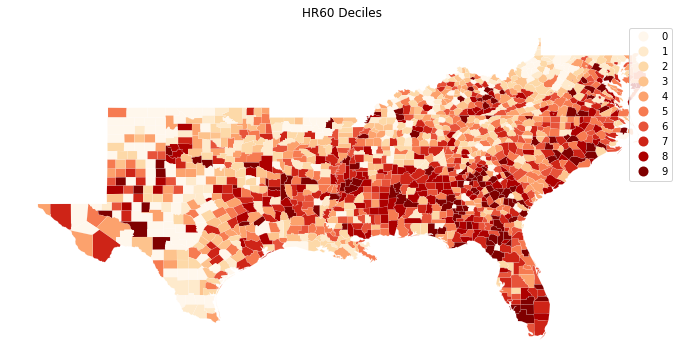
hr60_q10 = mc.Quantiles(df['HR60'], k=10)
hr60_q10
fig, ax = plt.subplots(figsize=(12,10), subplot_kw={'aspect':'equal'})
df.assign(cl=hr60_q10.yb).plot(column='cl', categorical=True, \
                              k=10, cmap='OrRd', linewidth=0.1, ax=ax, \
                              edgecolor='white', legend=True)
ax.set_axis_off()
plt.title('HR60 Deciles')
plt.savefig('hr60q10.png')
import numpy as np
np.random.seed(12345)
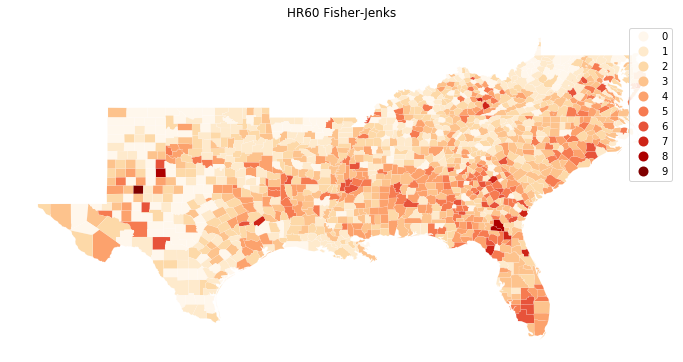
hr60_fj10 = mc.FisherJenks(df['HR60'], k=10)
hr60_fj10
fig, ax = plt.subplots(figsize=(12,10), subplot_kw={'aspect':'equal'})
df.assign(cl=hr60_fj10.yb).plot(column='cl', categorical=True, \
                              k=10, cmap='OrRd', linewidth=0.1, ax=ax, \
                              edgecolor='white', legend=True)
ax.set_axis_off()
plt.title('HR60 Fisher-Jenks')
plt.savefig('hr60fj10.png')
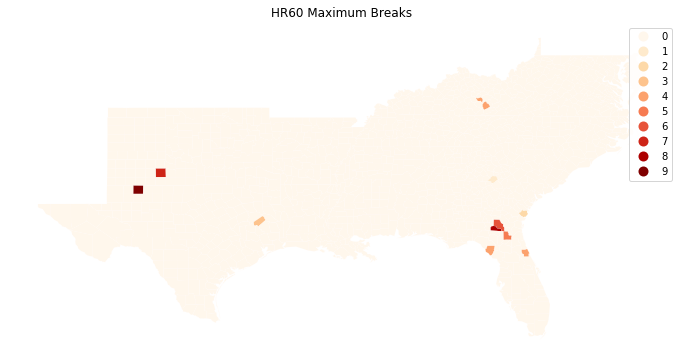
hr60_mb10 = mc.MaximumBreaks(df['HR60'], k=10)


fig, ax = plt.subplots(figsize=(12,10), subplot_kw={'aspect':'equal'})
df.assign(cl=hr60_mb10.yb).plot(column='cl', categorical=True, \
                              k=10, cmap='OrRd', linewidth=0.1, ax=ax, \
                              edgecolor='white', legend=True)
ax.set_axis_off()
plt.title('HR60 Maximum Breaks')
plt.savefig('hr60mb10.png')
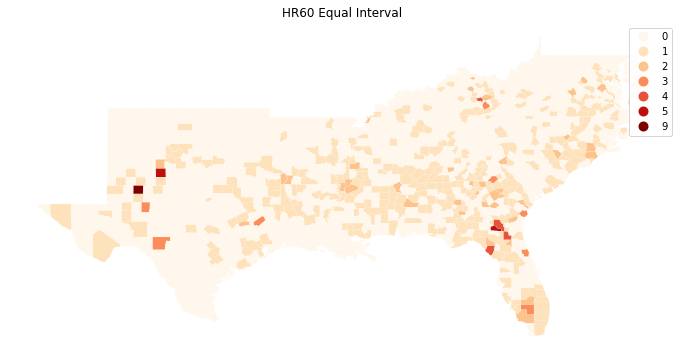
hr60_ea10 = mc.EqualInterval(df['HR60'], k=10)


fig, ax = plt.subplots(figsize=(12,10), subplot_kw={'aspect':'equal'})
df.assign(cl=hr60_ea10.yb).plot(column='cl', categorical=True, \
                              k=10, cmap='OrRd', linewidth=0.1, ax=ax, \
                              edgecolor='white', legend=True)
ax.set_axis_off()
plt.title('HR60 Equal Interval')
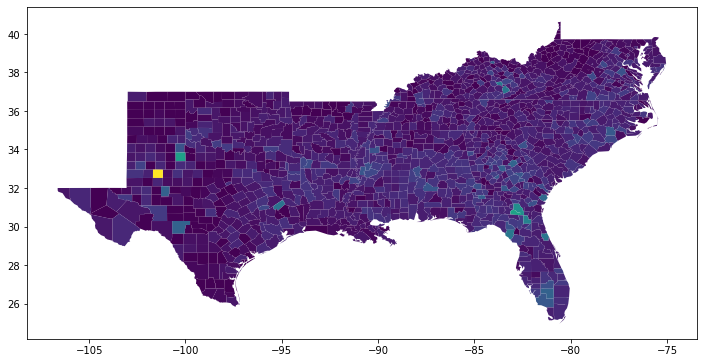
fig, ax = plt.subplots(figsize=(12,10), subplot_kw={'aspect':'equal'})
df.plot(column='HR60', ax=ax)
hr60_q5 = mc.Quantiles(df['HR60'], k=5)
hr60_q5