Search
GWR_Georgia_example
import numpy as np
import libpysal as ps
from mgwr.gwr import GWR, MGWR
from mgwr.sel_bw import Sel_BW
import geopandas as gp
import matplotlib.pyplot as plt
import matplotlib as mpl
import pandas as pd
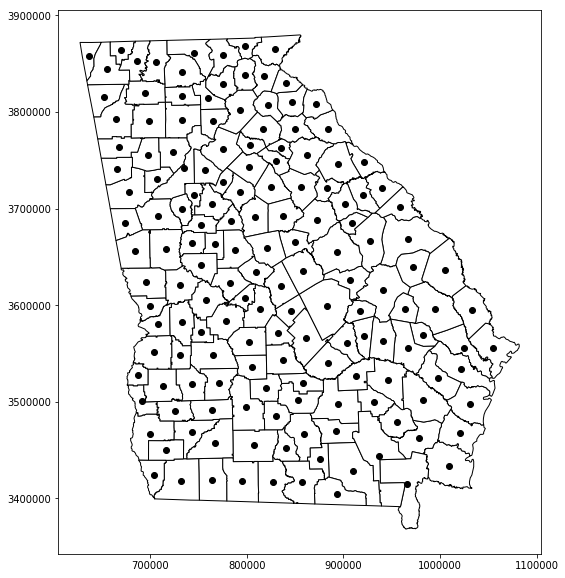
#Load Georgia dataset and generate plot of Georgia counties (figure 1)
georgia_data = pd.read_csv(ps.examples.get_path('GData_utm.csv'))
georgia_shp = gp.read_file(ps.examples.get_path('G_utm.shp'))
fig, ax = plt.subplots(figsize=(10,10))
georgia_shp.plot(ax=ax, **{'edgecolor':'black', 'facecolor':'white'})
georgia_shp.centroid.plot(ax=ax, c='black')
<matplotlib.axes._subplots.AxesSubplot at 0x1a2624ef60>
#Prepare Georgia dataset inputs
g_y = georgia_data['PctBach'].values.reshape((-1,1))
g_X = georgia_data[['PctFB', 'PctBlack', 'PctRural']].values
u = georgia_data['X']
v = georgia_data['Y']
g_coords = list(zip(u,v))

g_X = (g_X - g_X.mean(axis=0)) / g_X.std(axis=0)

g_y = g_y.reshape((-1,1))

g_y = (g_y - g_y.mean(axis=0)) / g_y.std(axis=0)
#Calibrate GWR model

gwr_selector = Sel_BW(g_coords, g_y, g_X)
gwr_bw = gwr_selector.search(bw_min=2)
print(gwr_bw)
gwr_results = GWR(g_coords, g_y, g_X, gwr_bw).fit()
117.0
gwr_results.params[0:5]
array([[-0.23204579,  0.22820815,  0.05697445, -0.42649461],
       [-0.2792238 ,  0.16511734,  0.09516542, -0.41226348],
       [-0.248944  ,  0.20466991,  0.07121197, -0.42573638],
       [-0.23036768,  0.1527493 ,  0.0510379 , -0.35938659],
       [ 0.19066196,  0.71627541, -0.16920186, -0.24091753]])
gwr_results.localR2[0:10]
array([[0.55932878],
       [0.5148705 ],
       [0.54751792],
       [0.50691577],
       [0.69062134],
       [0.69429812],
       [0.69813709],
       [0.70867337],
       [0.49985703],
       [0.49379842]])
gwr_results.summary()
===========================================================================
Model type                                                         Gaussian
Number of observations:                                                 159
Number of covariates:                                                     4

Global Regression Results
---------------------------------------------------------------------------
Residual sum of squares:                                             71.793
Log-likelihood:                                                    -162.399
AIC:                                                                332.798
AICc:                                                               335.191
BIC:                                                               -713.887
R2:                                                                   0.548
Adj. R2:                                                              0.540

Variable                              Est.         SE  t(Est/SE)    p-value
------------------------------- ---------- ---------- ---------- ----------
X0                                   0.000      0.054      0.000      1.000
X1                                   0.458      0.066      6.988      0.000
X2                                  -0.084      0.055     -1.525      0.127
X3                                  -0.374      0.065     -5.734      0.000

Geographically Weighted Regression (GWR) Results
---------------------------------------------------------------------------
Spatial kernel:                                           Adaptive bisquare
Bandwidth used:                                                     117.000

Diagnostic information
---------------------------------------------------------------------------
Residual sum of squares:                                             51.186
Effective number of parameters (trace(S)):                           11.805
Degree of freedom (n - trace(S)):                                   147.195
Sigma estimate:                                                       0.590
Log-likelihood:                                                    -135.503
AIC:                                                                296.616
AICc:                                                               299.051
BIC:                                                                335.913
R2:                                                                   0.678
Adjusted R2:                                                          0.652
Adj. alpha (95%):                                                     0.017
Adj. critical t value (95%):                                          2.414

Summary Statistics For GWR Parameter Estimates
---------------------------------------------------------------------------
Variable                   Mean        STD        Min     Median        Max
-------------------- ---------- ---------- ---------- ---------- ----------
X0                       -0.004      0.180     -0.296      0.111      0.208
X1                        0.477      0.234      0.123      0.556      0.741
X2                       -0.043      0.083     -0.170     -0.053      0.100
X3                       -0.328      0.060     -0.464     -0.308     -0.241
===========================================================================