Minimum_bounding_circle
import matplotlib.pyplot as plt
import matplotlib.collections as mplc
import libpysal as ps
from shapely import geometry as sgeom
import descartes as des
import pointpats
%matplotlib inline
data = ps.io.open(ps.examples.get_path('columbus.shp')).read()
chains = [chain.parts[0] for chain in data]
points = chains[0]
points
Let's plot that polygon by interpreting it in Shapely and using its draw behavior.
poly = sgeom.Polygon(points)
poly
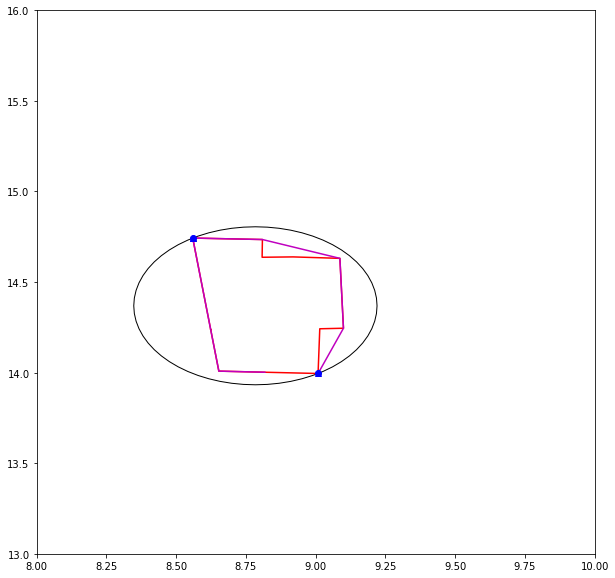
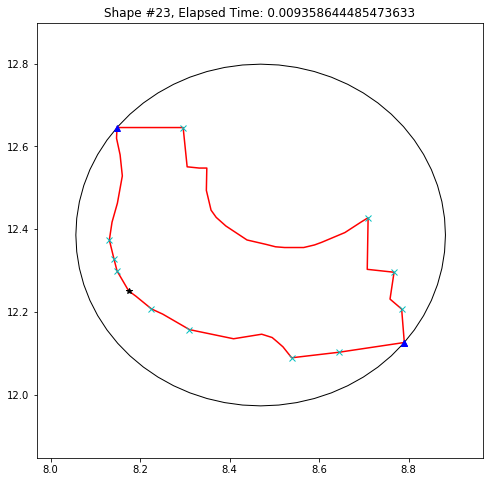
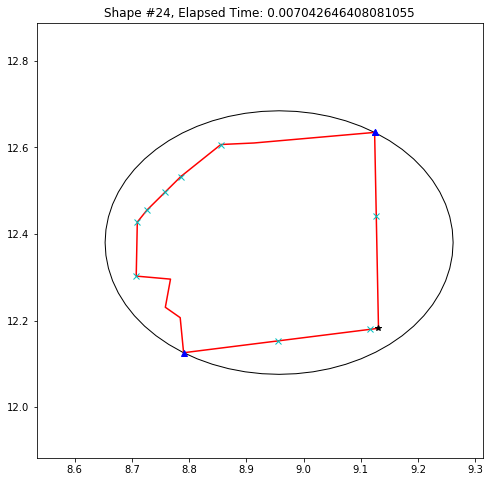
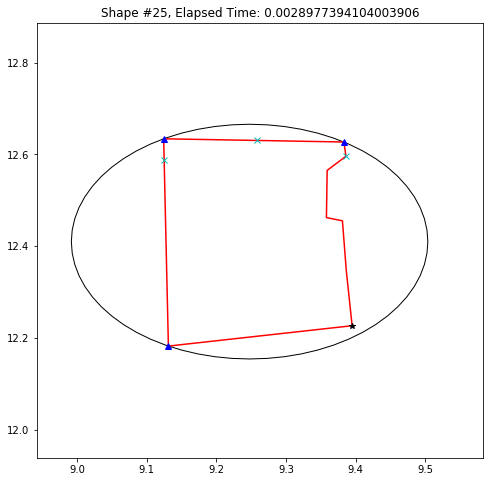
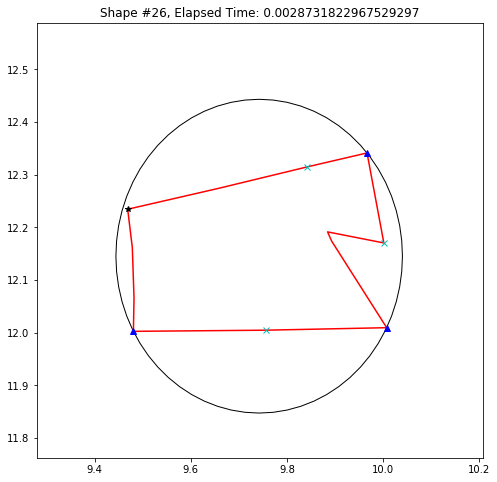
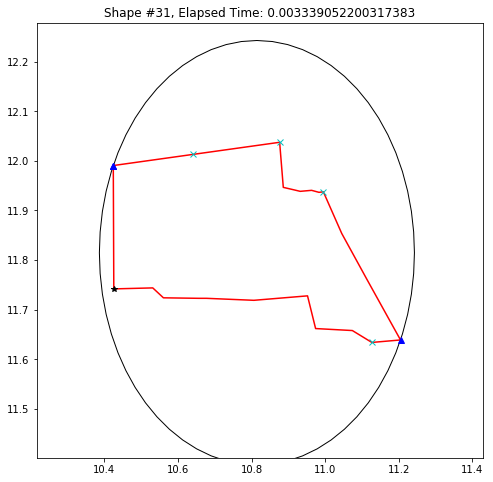
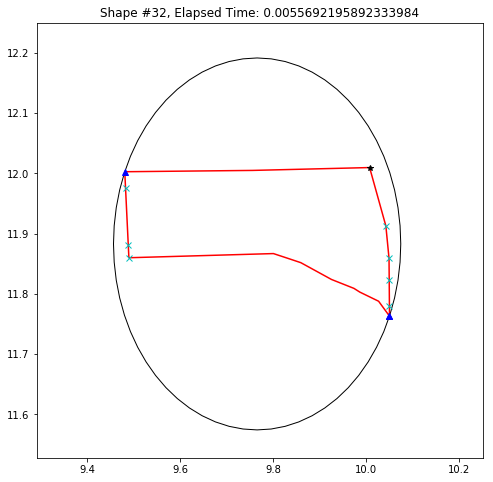
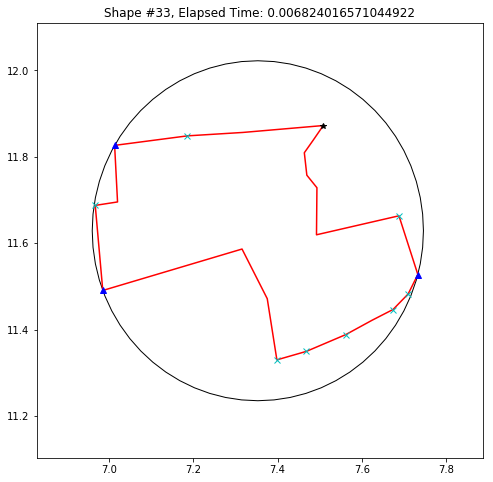
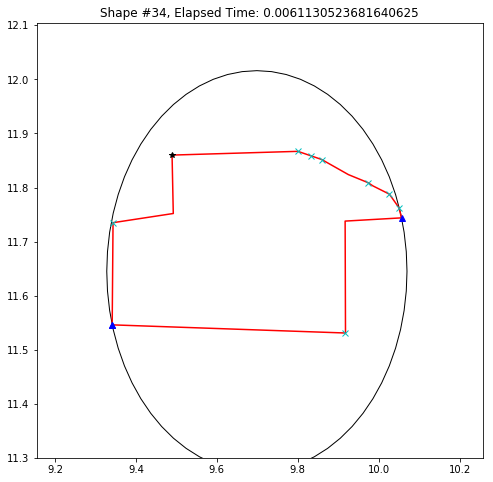
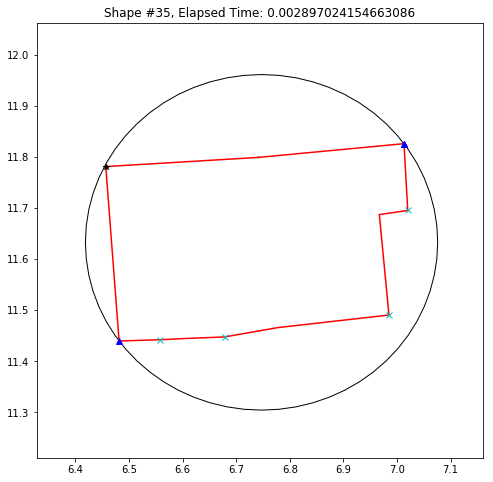
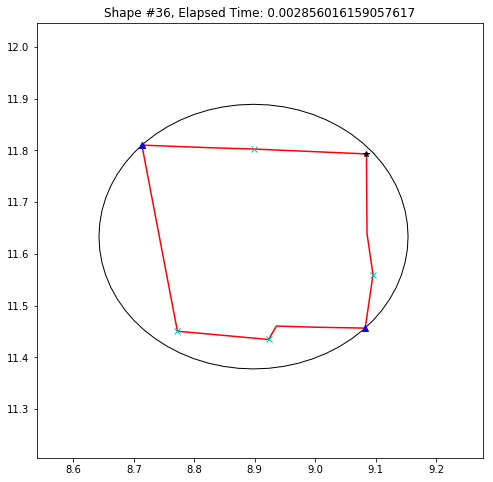
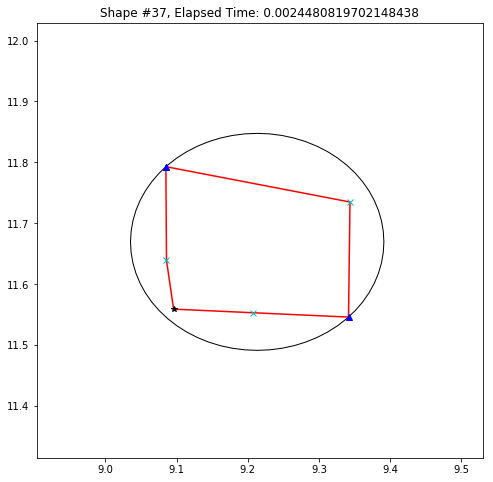
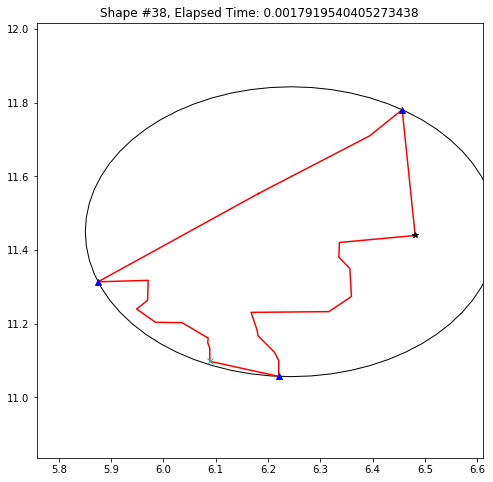
Nifty. Now, I've implemented Skyum's method for finding the Minimum Bounding Circle for a set of points in centrography.
Right now, there's some extra printing. Essentially, if you have sufficiently straight lines on the boundary, the equations for the circumcenter of the tuple $(p,q,r)$ explodes. Thus, I test if $\angle (p,q,r)$ identifies a circle whose diameter is $(p,r)$ or $(p,q)$. There are two triplets of straight enough lines, so their circle equations are modified, and I retain printing for bug diagnostics.
(radius, center), inset, removed, constraints = pointpats.skyum(points)
#p,q,r = cent.skyum(points)
#mbc = cent._circle(points[p], points[q], points[r])
#mbc = cent._circle()
mbc_poly = sgeom.Point(*center).buffer(radius)
fig = plt.figure(figsize=(10,10))
ax = fig.add_subplot(111)
ax.set_xlim(8, 10)
ax.set_ylim(13,16)
ax.plot([p[0] for p in points], [p[-1] for p in points], 'r')
ax.add_patch(des.PolygonPatch(mbc_poly, fc='white', ec='black'))
chull = pointpats.hull(points)
ax.plot([p[0] for p in chull], [p[-1] for p in chull], 'm')
ax.plot([p[0] for p in constraints], [p[-1] for p in constraints], '^b')
ax.plot([p[0] for p in inset], [p[-1] for p in inset], 'ob')
ax.plot([p[0] for p in removed], [p[-1] for p in removed], 'xb')
plt.show()
import time
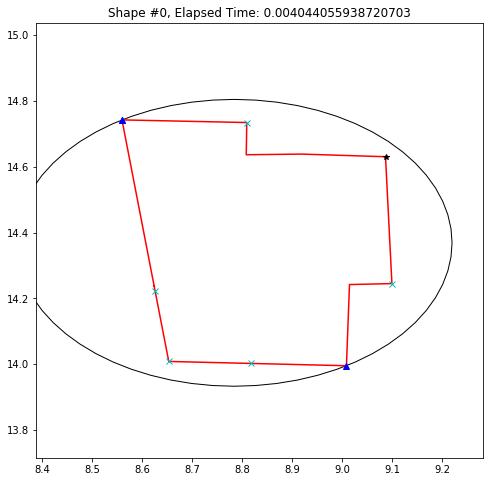
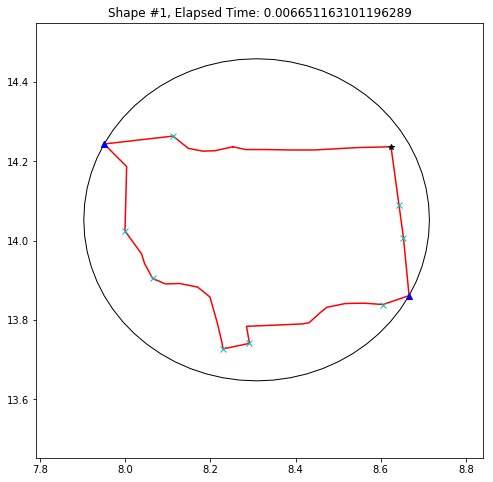
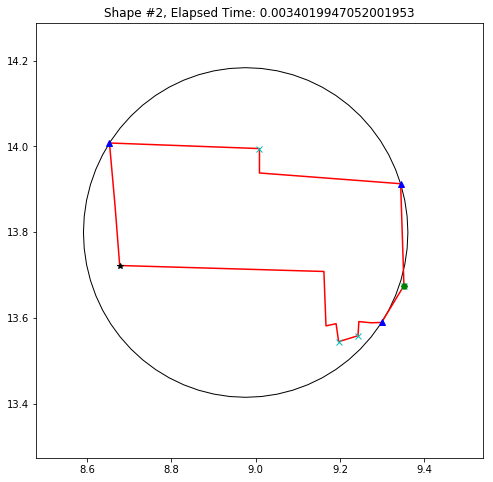
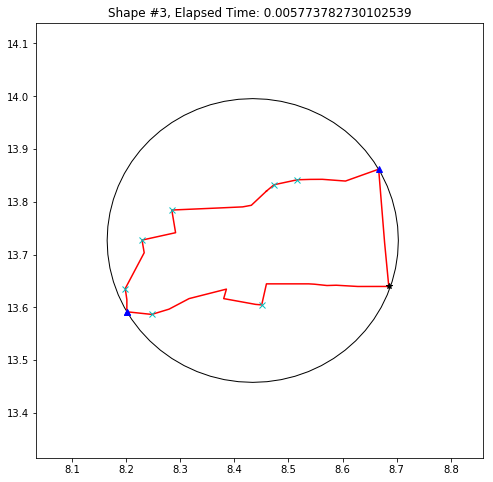
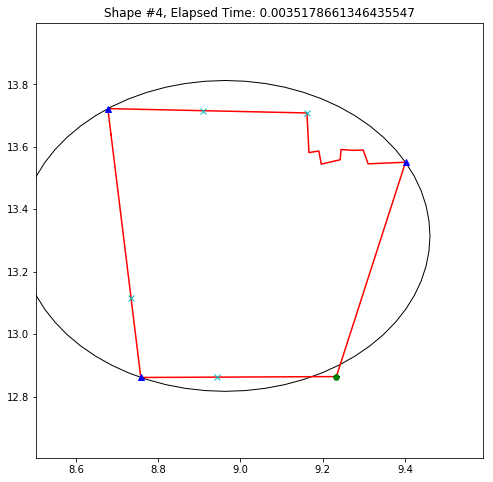
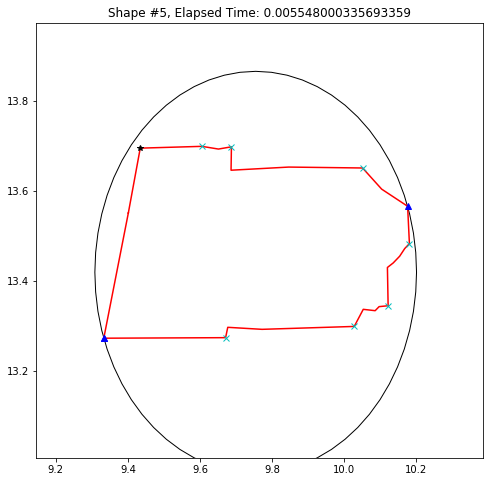
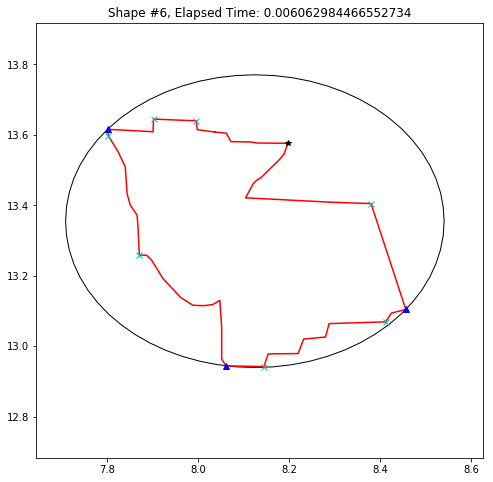
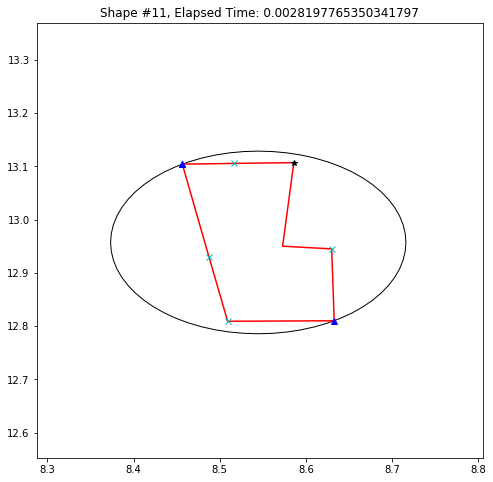
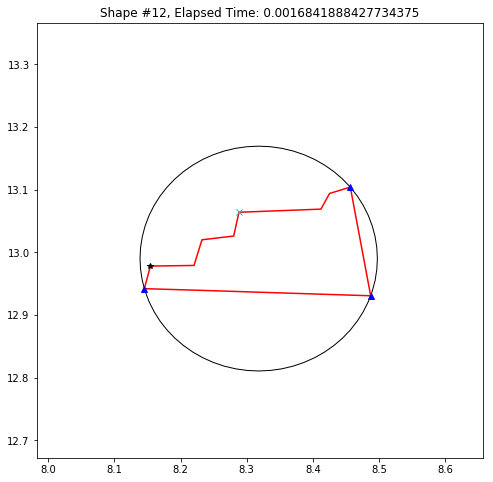
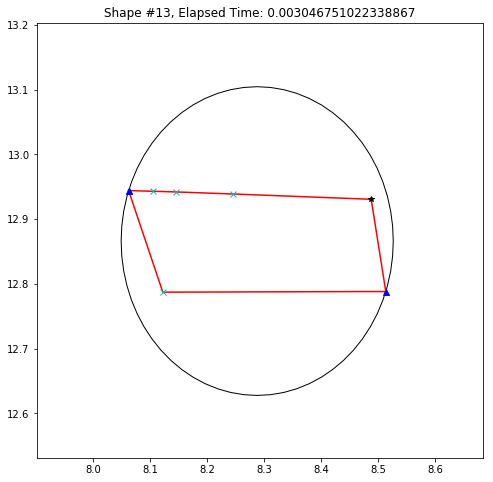
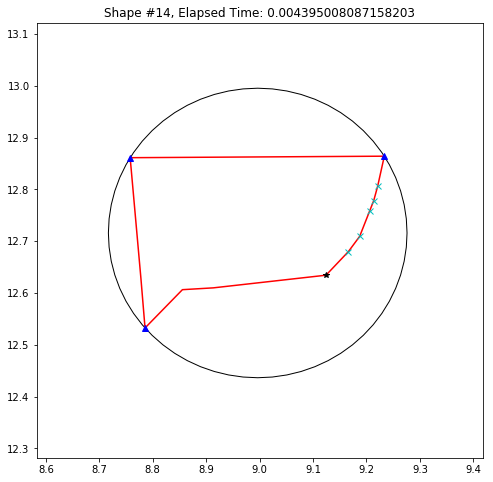
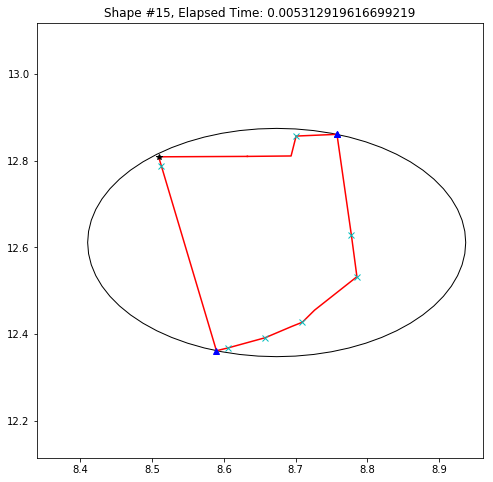
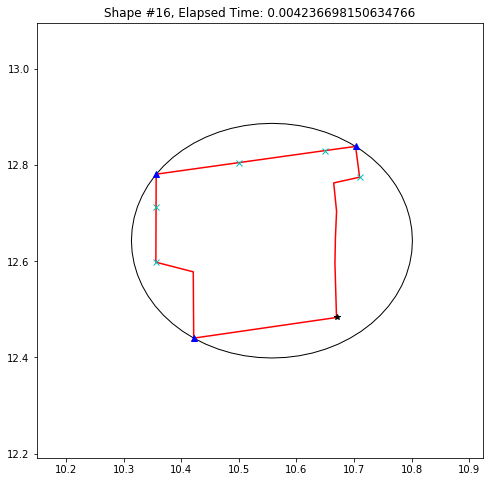
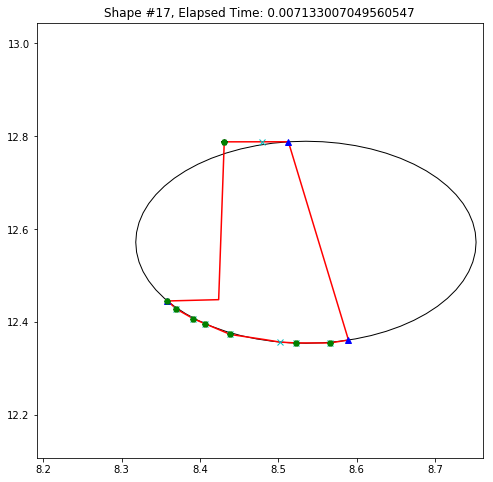
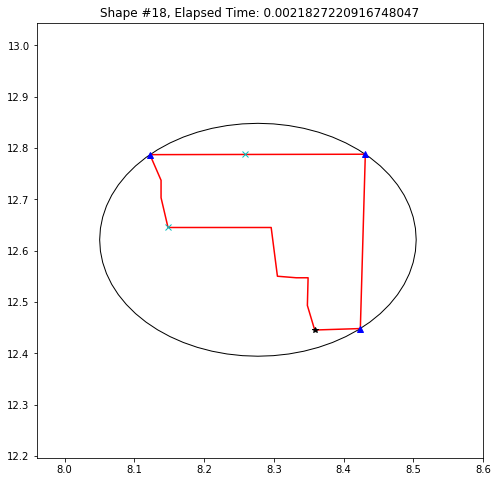
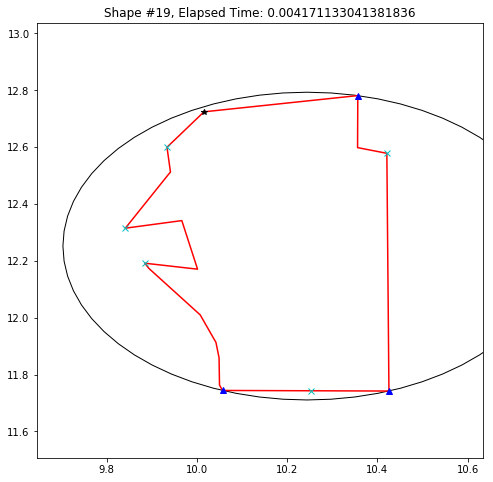
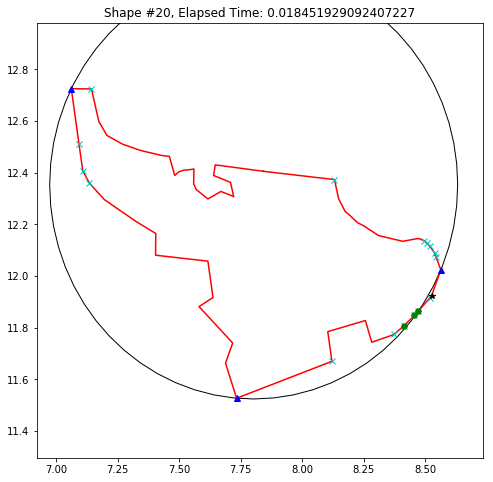
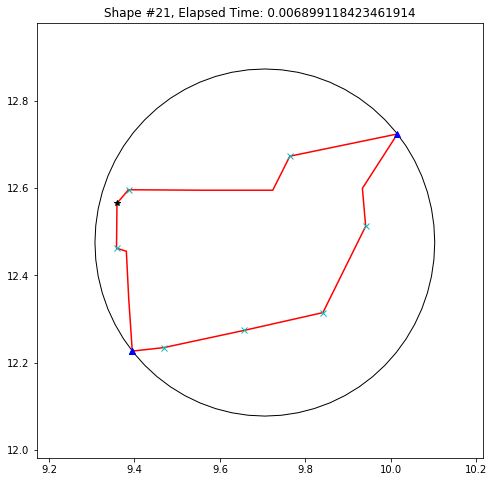
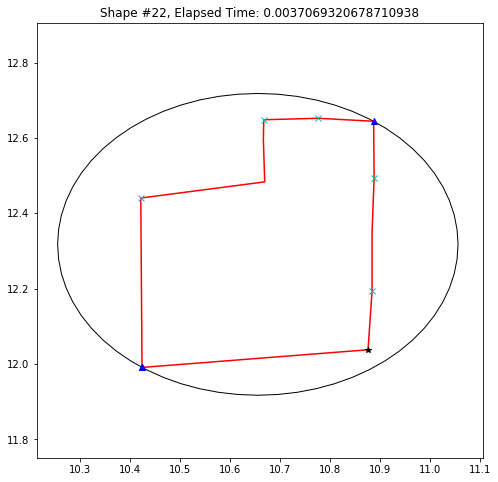
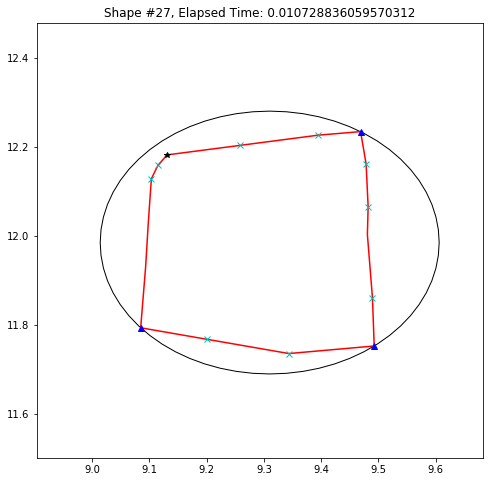
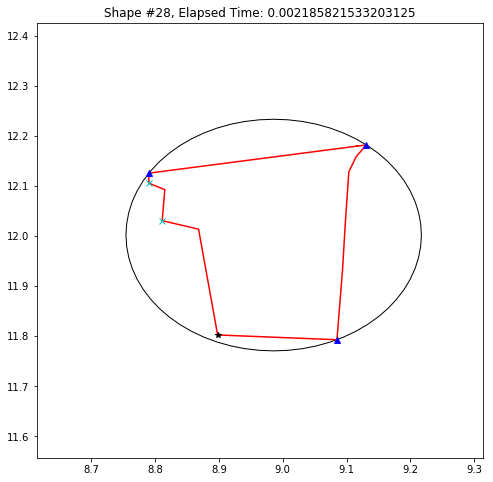
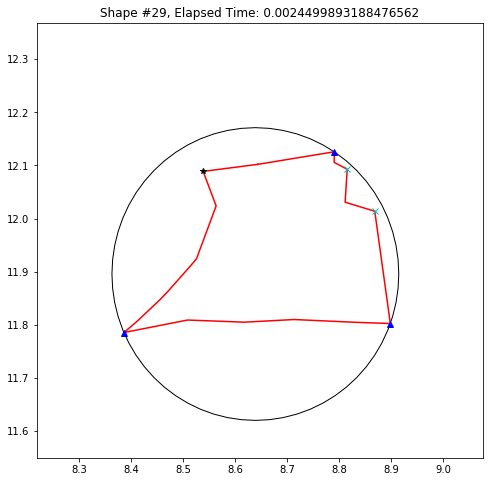
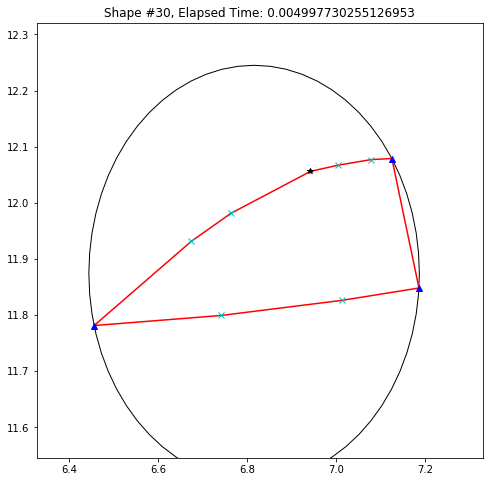
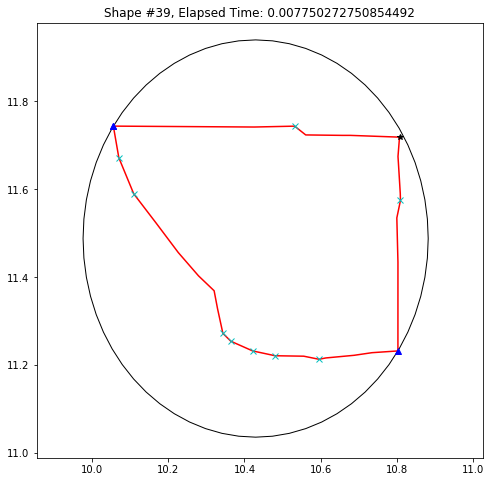
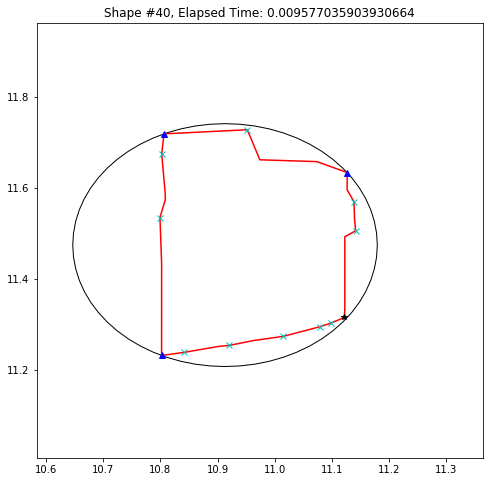
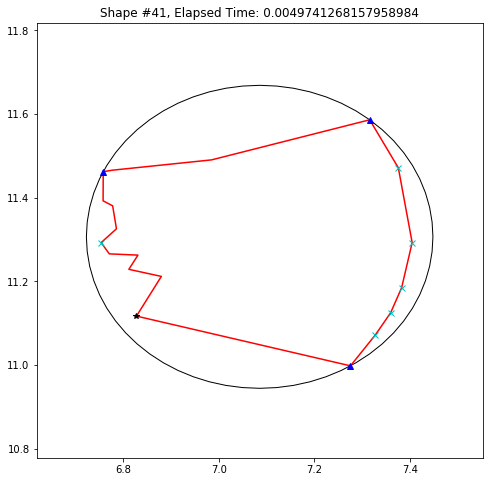
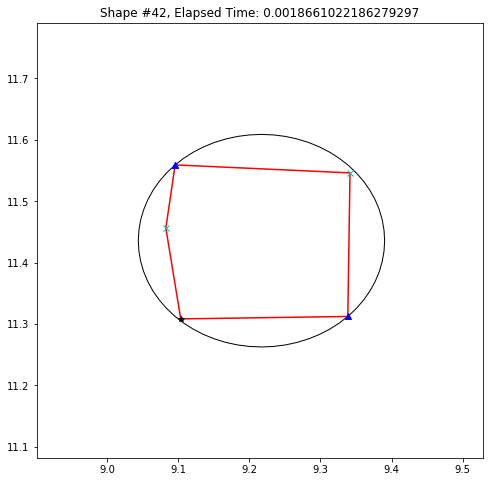
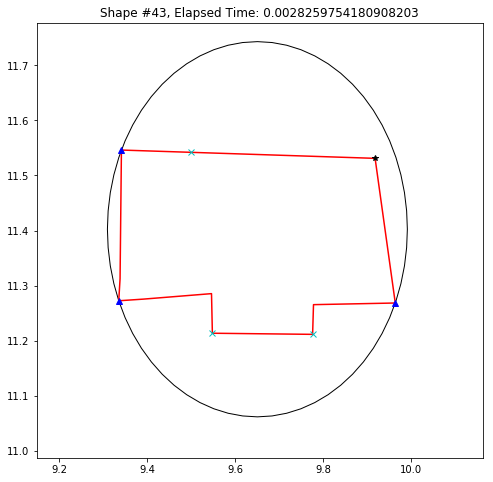
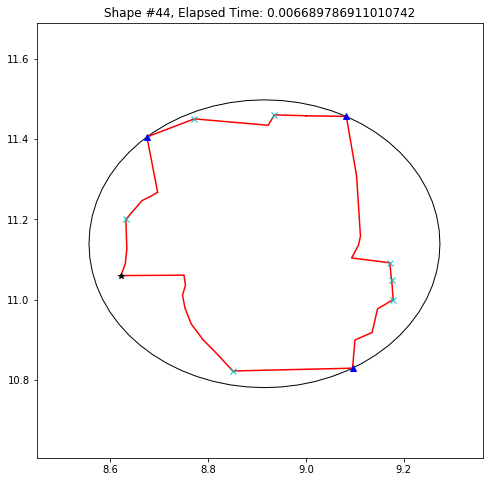
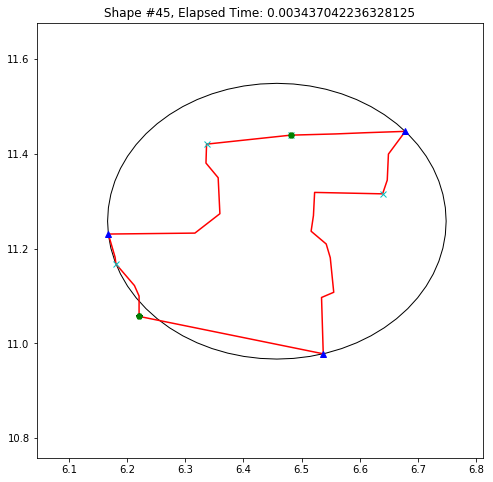
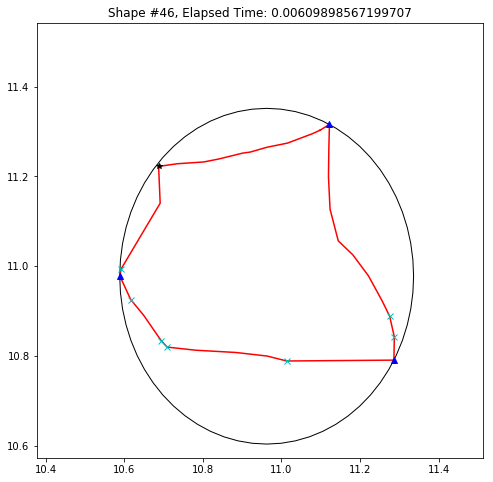
def demo_mbc(chains):
    for cidx, chain in enumerate(chains):
        points = chain
        start = time.time()
        (radius, center), inset, removed, constraints = pointpats.skyum(chain)
        elapsed = time.time() - start
        mbc_poly = sgeom.Point(*center).buffer(radius)
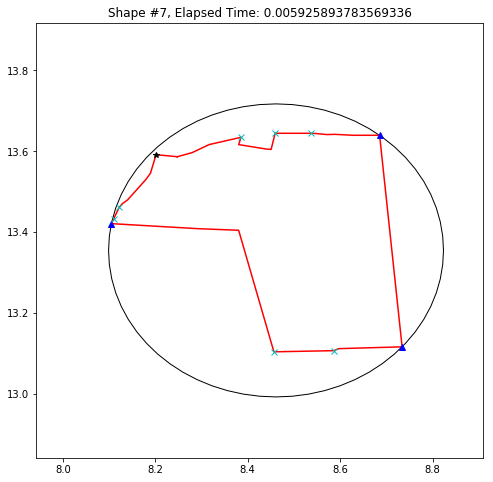
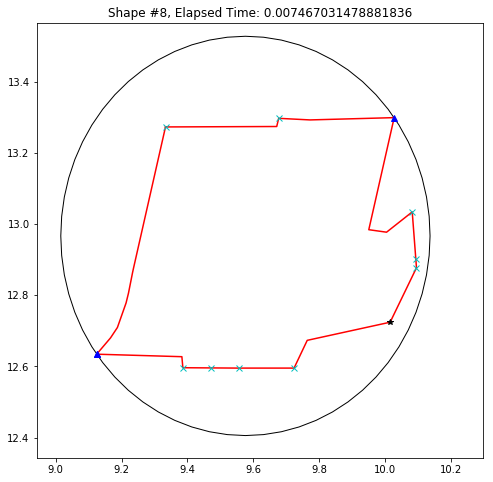
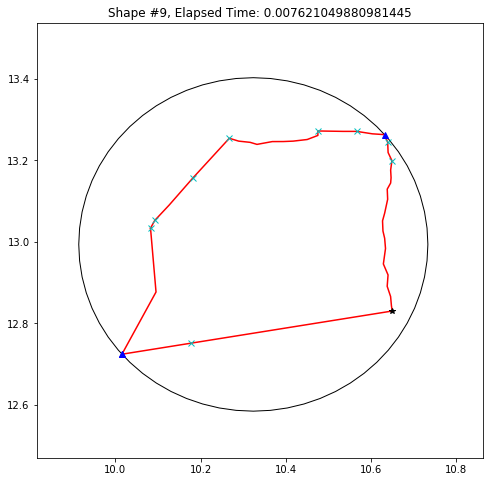
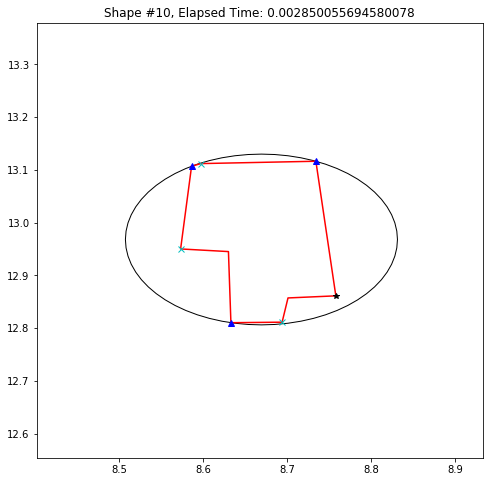
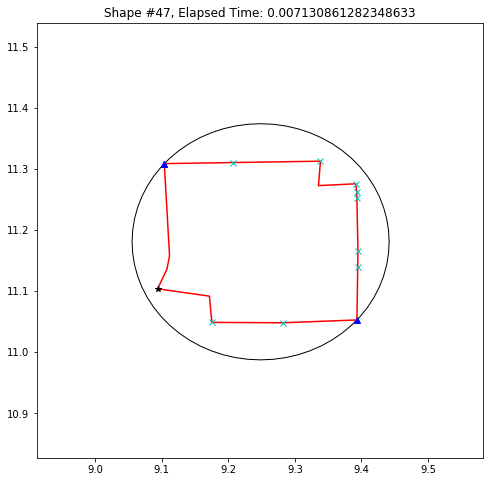
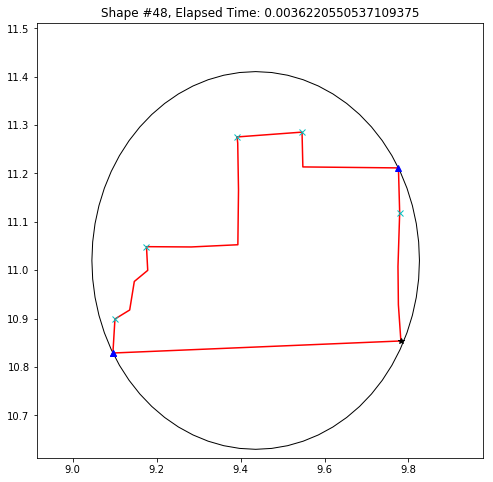
        fig = plt.figure(figsize=(8,8))
        ax = fig.add_subplot(111)
        parray = ps.common.np.array(points)
        ax.set_xlim(parray[:,0].min()*.98, parray[:,0].max()*1.02)
        ax.set_ylim(parray[:,1].min()*.98, parray[:,1].max()*1.02)
        ax.plot([p[0] for p in points], [p[-1] for p in points], 'r')
        ax.add_patch(des.PolygonPatch(mbc_poly, fc='white', ec='black'))
        chull = pointpats.hull(points)
        #ax.plot([p[0] for p in chull], [p[-1] for p in chull], '--m')
        ax.plot([p[0] for p in constraints], [p[-1] for p in constraints], '^b')
        #ax.plot([p[0] for p in inset], [p[-1] for p in inset], 'ob')
        ax.plot([p[0][0] for p in removed[:-1]], [p[0][1] for p in removed[:-1]], 'xc')
        ax.plot(removed[-1][0][0], removed[-1][0][1], '*k')
        plt.title('Shape #{}, Elapsed Time: {}'.format(cidx, elapsed))
        #print(removed)
        nonboundary = [p for p in chull.tolist() if p not in constraints]
        succeeded = [mbc_poly.contains(sgeom.Point(p)) for p in nonboundary]
        for i,v in enumerate(succeeded):
            print("Point {i}: {tf}".format(i=i, tf=v))
            if not v:
                ax.plot(chull.tolist()[i][0], chull.tolist()[i][1], 'gH')
        plt.show()
        plt.clf()
demo_mbc(chains)
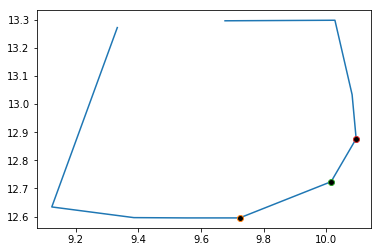
pointpats.hull(chains[8])
plt.plot(*pointpats.hull(chains[8]).T.tolist())
plt.plot(*pointpats.hull(chains[8])[5].T.tolist(), markerfacecolor='k', marker='o')
plt.plot(*pointpats.hull(chains[8])[6].T.tolist(), markerfacecolor='k', marker='o')
plt.plot(*pointpats.hull(chains[8])[7].T.tolist(), markerfacecolor='k', marker='o')
pointpats._circle(chains[8][-5], chains[8][-4], chains[8][-3])

