quickstart
If any part of this notebook is used in your research, please cite with the reference found in README.md.
Quickstart
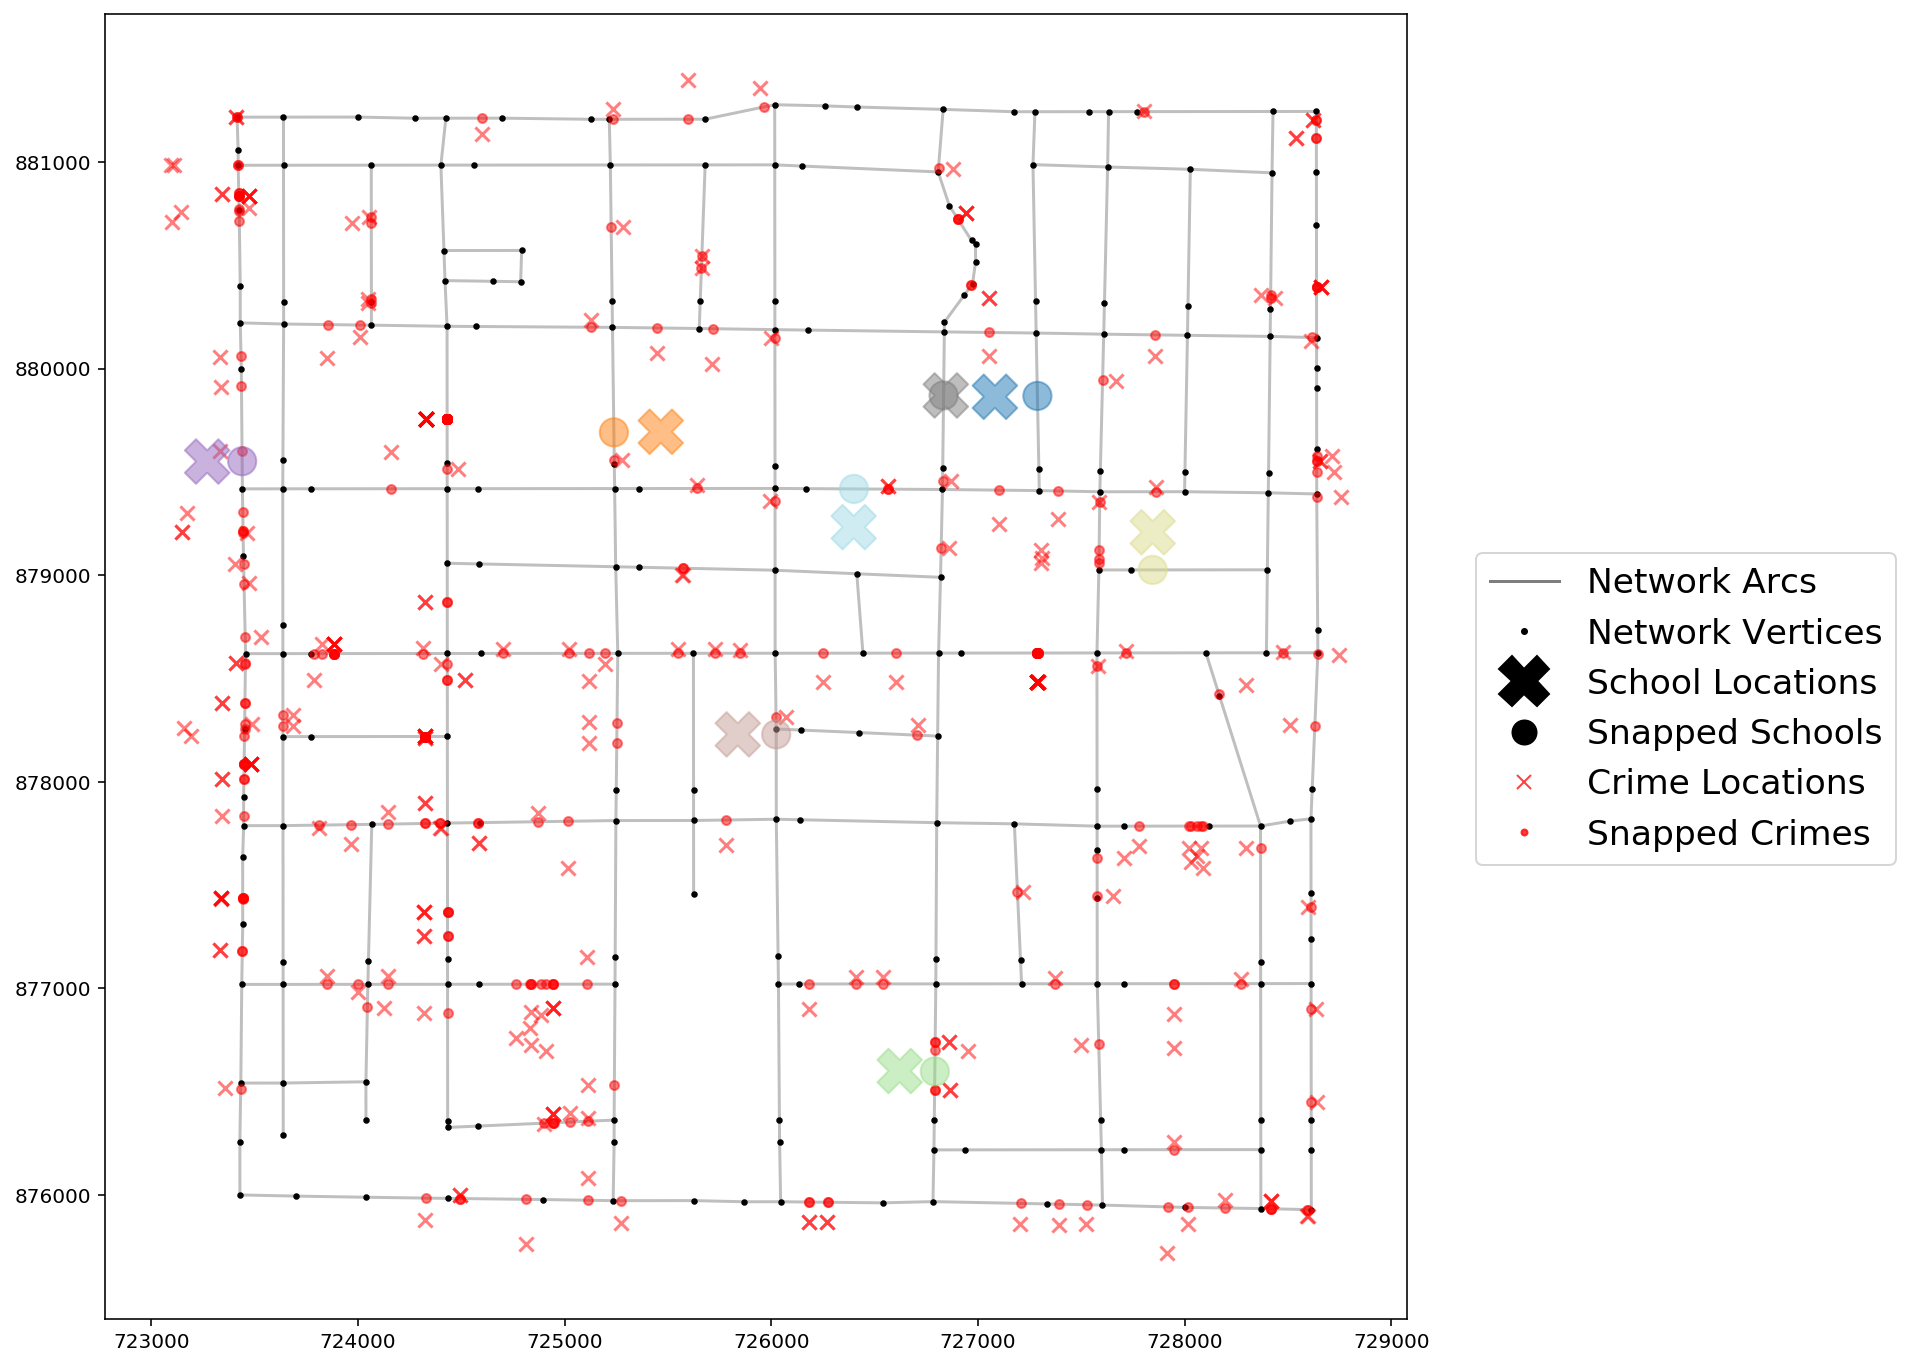
Creating and visualizing a spaghetti.Network object
Author: James D. Gaboardi jgaboardi@gmail.com
This notebook is a basic walk-through for:
- Instantiating a network
- Allocating observations to a network (snapping points)
- Visualizing the original and network-snapped locations with
geopandasandmatplotlib
%load_ext watermark
%watermark
In addtion to the base spaghetti requirements (and their dependecies), this notebook requires installations of:
- descartes
$ conda install -c conda-forge descartes
- geopandas
$ conda install -c conda-forge geopandas
- matplotlib
$ conda install matplotlib
import spaghetti
import geopandas
import libpysal
import matplotlib
import matplotlib.pyplot as plt
import matplotlib.lines as mlines
try:
    from IPython.display import set_matplotlib_formats
    set_matplotlib_formats("retina")
except ImportError:
    pass
%matplotlib inline
%watermark -w
%watermark -iv
ntw = spaghetti.Network(in_data=libpysal.examples.get_path("streets.shp"))
ntw.snapobservations(
    libpysal.examples.get_path("schools.shp"), "schools", attribute=False
)
print("observation 1\ntrue coords:\t%s\nsnapped coords:\t%s" % (
    ntw.pointpatterns["schools"].points[0]["coordinates"],
    ntw.pointpatterns["schools"].snapped_coordinates[0]
))
ntw.snapobservations(
    libpysal.examples.get_path("crimes.shp"), "crimes", attribute=True
)
print("observation 1\ntrue coords:\t%s\nsnapped coords:\t%s" % (
    ntw.pointpatterns["crimes"].points[0]["coordinates"],
    ntw.pointpatterns["crimes"].snapped_coordinates[0]
))
true_schools_df = spaghetti.element_as_gdf(
    ntw, pp_name="schools", snapped=False
)
snapped_schools_df = spaghetti.element_as_gdf(
    ntw, pp_name="schools", snapped=True
)
# Compare true point coordinates & snapped point coordinates
print("observation 1\ntrue coords:\t%s\nsnapped coords:\t%s" % (
    true_schools_df.geometry[0].coords[:][0],
    snapped_schools_df.geometry[0].coords[:][0]
))
true_crimes_df = spaghetti.element_as_gdf(
    ntw, pp_name="crimes", snapped=False
)
snapped_crimes_df = spaghetti.element_as_gdf(
    ntw, pp_name="crimes", snapped=True
)
print("observation 1\ntrue coords:\t%s\nsnapped coords:\t%s" % (
    true_crimes_df.geometry[0].coords[:][0],
    snapped_crimes_df.geometry[0].coords[:][0]
))
# network nodes and edges
vertices_df, arcs_df = spaghetti.element_as_gdf(ntw, vertices=True, arcs=True)
# create legend arguments and keyword arguments for matplotlib
args = [], []
kwargs = {"c":"k"}

# set arcs legend entry
arcs = mlines.Line2D(*args, **kwargs, label="Network Arcs", alpha=0.5)

# update keyword arguments for matplotlib
kwargs.update({"lw":0})

# set vertices legend entry
vertices = mlines.Line2D(
    *args, **kwargs, ms=2.5, marker="o", label="Network Vertices"
)
# set true school locations legend entry
tschools = mlines.Line2D(
    *args, **kwargs, ms=25, marker="X", label="School Locations"
)
# set network-snapped school locations legend entry
sschools = mlines.Line2D(
    *args, **kwargs, ms=12, marker="o", label="Snapped Schools"
)
# update keyword arguments for matplotlib
kwargs.update({"c":"r", "alpha":0.75})

# set true crimes locations legend entry
tcrimes = mlines.Line2D(
    *args, **kwargs, ms=7, marker="x", label="Crime Locations"
)
# set network-snapped crimes locations legend entry
scrimes = mlines.Line2D(
    *args, **kwargs, ms=3, marker="o", label="Snapped Crimes"
)
# combine all legend patches
patches = [arcs, vertices, tschools, sschools, tcrimes, scrimes]
# set the streets as the plot base
base = arcs_df.plot(color="k", alpha=0.25, figsize=(12, 12), zorder=0)

# create vertices keyword arguments for matplotlib
kwargs = {"ax":base}
vertices_df.plot(color="k", markersize=5, alpha=1, **kwargs)

# update crime keyword arguments for matplotlib
kwargs.update({"alpha":0.5, "zorder":1})
true_crimes_df.plot(color="r", marker="x", markersize=50, **kwargs)
snapped_crimes_df.plot(color="r", markersize=20, **kwargs)

# update schools keyword arguments for matplotlib
kwargs.update({"cmap":"tab20", "column":"id", "zorder":2})
true_schools_df.plot(marker="X", markersize=500, **kwargs)
snapped_schools_df.plot(markersize=200, **kwargs)

# add legend
plt.legend(
    handles=patches,
    fancybox=True,
    framealpha=0.8,
    scatterpoints=1,
    fontsize="xx-large",
    bbox_to_anchor=(1.04, 0.6),
);