marks
Marked Point Pattern
In addition to the unmarked point pattern, non-binary attributes might be associated with each point, leading to the so-called marked point pattern. The charactertistics of a marked point pattern are:
- Location pattern of the events are of interest
- Stochastic attribute attached to the events is of interest
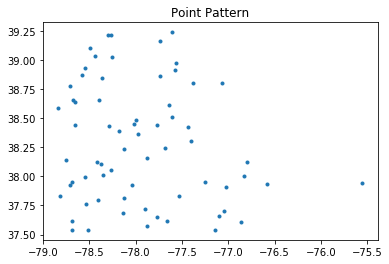
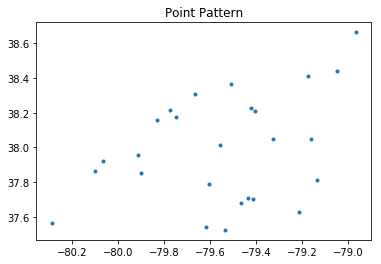
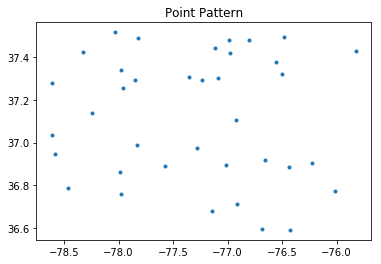
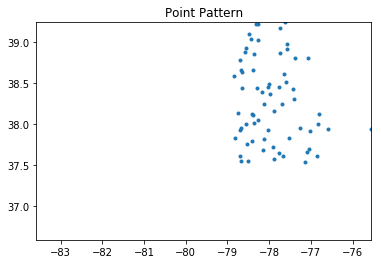
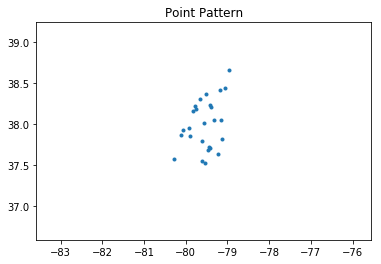
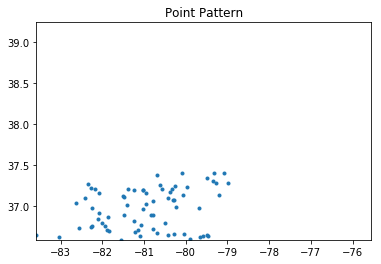
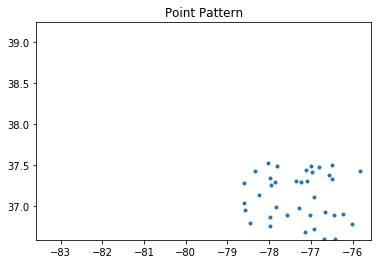
Unmarked point pattern can be modified to be a marked point pattern using the method add_marks while the method explode could decompose a marked point pattern into a sequence of unmarked point patterns. Both methods belong to the class PointPattern.
from pointpats import PoissonPointProcess, PoissonClusterPointProcess, Window, poly_from_bbox, PointPattern
import libpysal as ps
from libpysal.cg import shapely_ext
%matplotlib inline
import matplotlib.pyplot as plt
# open the virginia polygon shapefile
va = ps.io.open(ps.examples.get_path("virginia.shp"))
polys = [shp for shp in va]
# Create the exterior polygons for VA from the union of the county shapes
state = shapely_ext.cascaded_union(polys)
# create window from virginia state boundary
window = Window(state.parts)
window.bbox
window.centroid
samples = PoissonPointProcess(window, 200, 1, conditioning=False, asPP=False)
csr = PointPattern(samples.realizations[0])
cx, cy = window.centroid
cx
cy
west = csr.points.x < cx
south = csr.points.y < cy
east = 1 - west
north = 1 - south
quad = 1 * east * north + 2 * west * north + 3 * west * south + 4 * east * south
type(quad)
quad
csr.add_marks([quad], mark_names=['quad'])
csr.df
csr_q = csr.explode('quad')
len(csr_q)
csr
csr.summary()
plt.xlim?
plt.xlim()
for ppn in csr_q:
    ppn.plot()
x0, y0, x1, y1 = csr.mbb
ylim = (y0, y1)
xlim = (x0, x1)
for ppn in csr_q:
    ppn.plot()
    plt.xlim(xlim)
    plt.ylim(ylim)

