MGWR_Georgia_example
Anaconda install instructions as of mgwr 1.0.2 and Conda 4.5:
conda update conda
conda update anaconda
conda update scipy
conda install pysal
pip install libpysal
conda install mgwr
conda install geopandas
import numpy as np
import libpysal as ps
from mgwr.gwr import GWR, MGWR
from mgwr.sel_bw import Sel_BW
from mgwr.utils import shift_colormap, truncate_colormap
import geopandas as gp
import matplotlib.pyplot as plt
import matplotlib as mpl
import pandas as pd
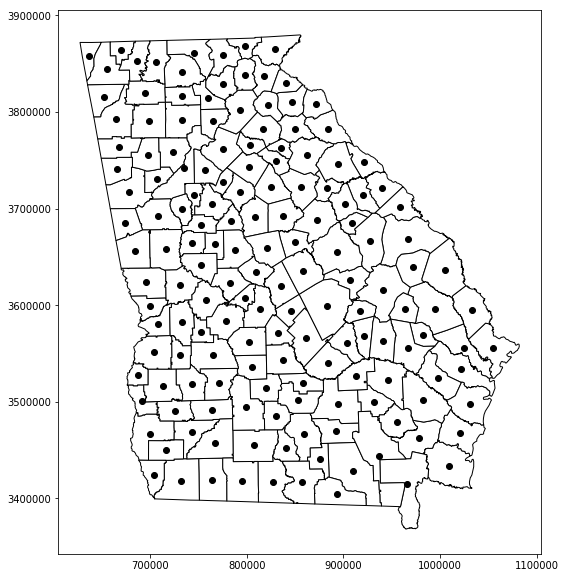
#Load Georgia dataset and generate plot of Georgia counties (figure 1)
georgia_data = pd.read_csv(ps.examples.get_path('GData_utm.csv'))
georgia_shp = gp.read_file(ps.examples.get_path('G_utm.shp'))
fig, ax = plt.subplots(figsize=(10,10))
georgia_shp.plot(ax=ax, **{'edgecolor':'black', 'facecolor':'white'})
georgia_shp.centroid.plot(ax=ax, c='black')
#Prepare Georgia dataset inputs
g_y = georgia_data['PctBach'].values.reshape((-1,1))
g_X = georgia_data[['PctFB', 'PctBlack', 'PctRural']].values
u = georgia_data['X']
v = georgia_data['Y']
g_coords = list(zip(u,v))

g_X = (g_X - g_X.mean(axis=0)) / g_X.std(axis=0)

g_y = g_y.reshape((-1,1))

g_y = (g_y - g_y.mean(axis=0)) / g_y.std(axis=0)
#Calibrate GWR model

gwr_selector = Sel_BW(g_coords, g_y, g_X)
gwr_bw = gwr_selector.search(bw_min=2)
print(gwr_bw)
gwr_results = GWR(g_coords, g_y, g_X, gwr_bw).fit()
#Calibrate MGWR model

mgwr_selector = Sel_BW(g_coords, g_y, g_X, multi=True)
mgwr_bw = mgwr_selector.search(multi_bw_min=[2])
print(mgwr_bw)
mgwr_results = MGWR(g_coords, g_y, g_X, mgwr_selector).fit()
mgwr_results.summary()
#Prepare GWR results for mapping

#Add GWR parameters to GeoDataframe
georgia_shp['gwr_intercept'] = gwr_results.params[:,0]
georgia_shp['gwr_fb'] = gwr_results.params[:,1]
georgia_shp['gwr_aa'] = gwr_results.params[:,2]
georgia_shp['gwr_rural'] = gwr_results.params[:,3]

#Obtain t-vals filtered based on multiple testing correction
gwr_filtered_t = gwr_results.filter_tvals()
#Prepare MGWR results for mapping

#Add MGWR parameters to GeoDataframe
georgia_shp['mgwr_intercept'] = mgwr_results.params[:,0]
georgia_shp['mgwr_fb'] = mgwr_results.params[:,1]
georgia_shp['mgwr_aa'] = mgwr_results.params[:,2]
georgia_shp['mgwr_rural'] = mgwr_results.params[:,3]

#Obtain t-vals filtered based on multiple testing correction
mgwr_filtered_t = mgwr_results.filter_tvals()
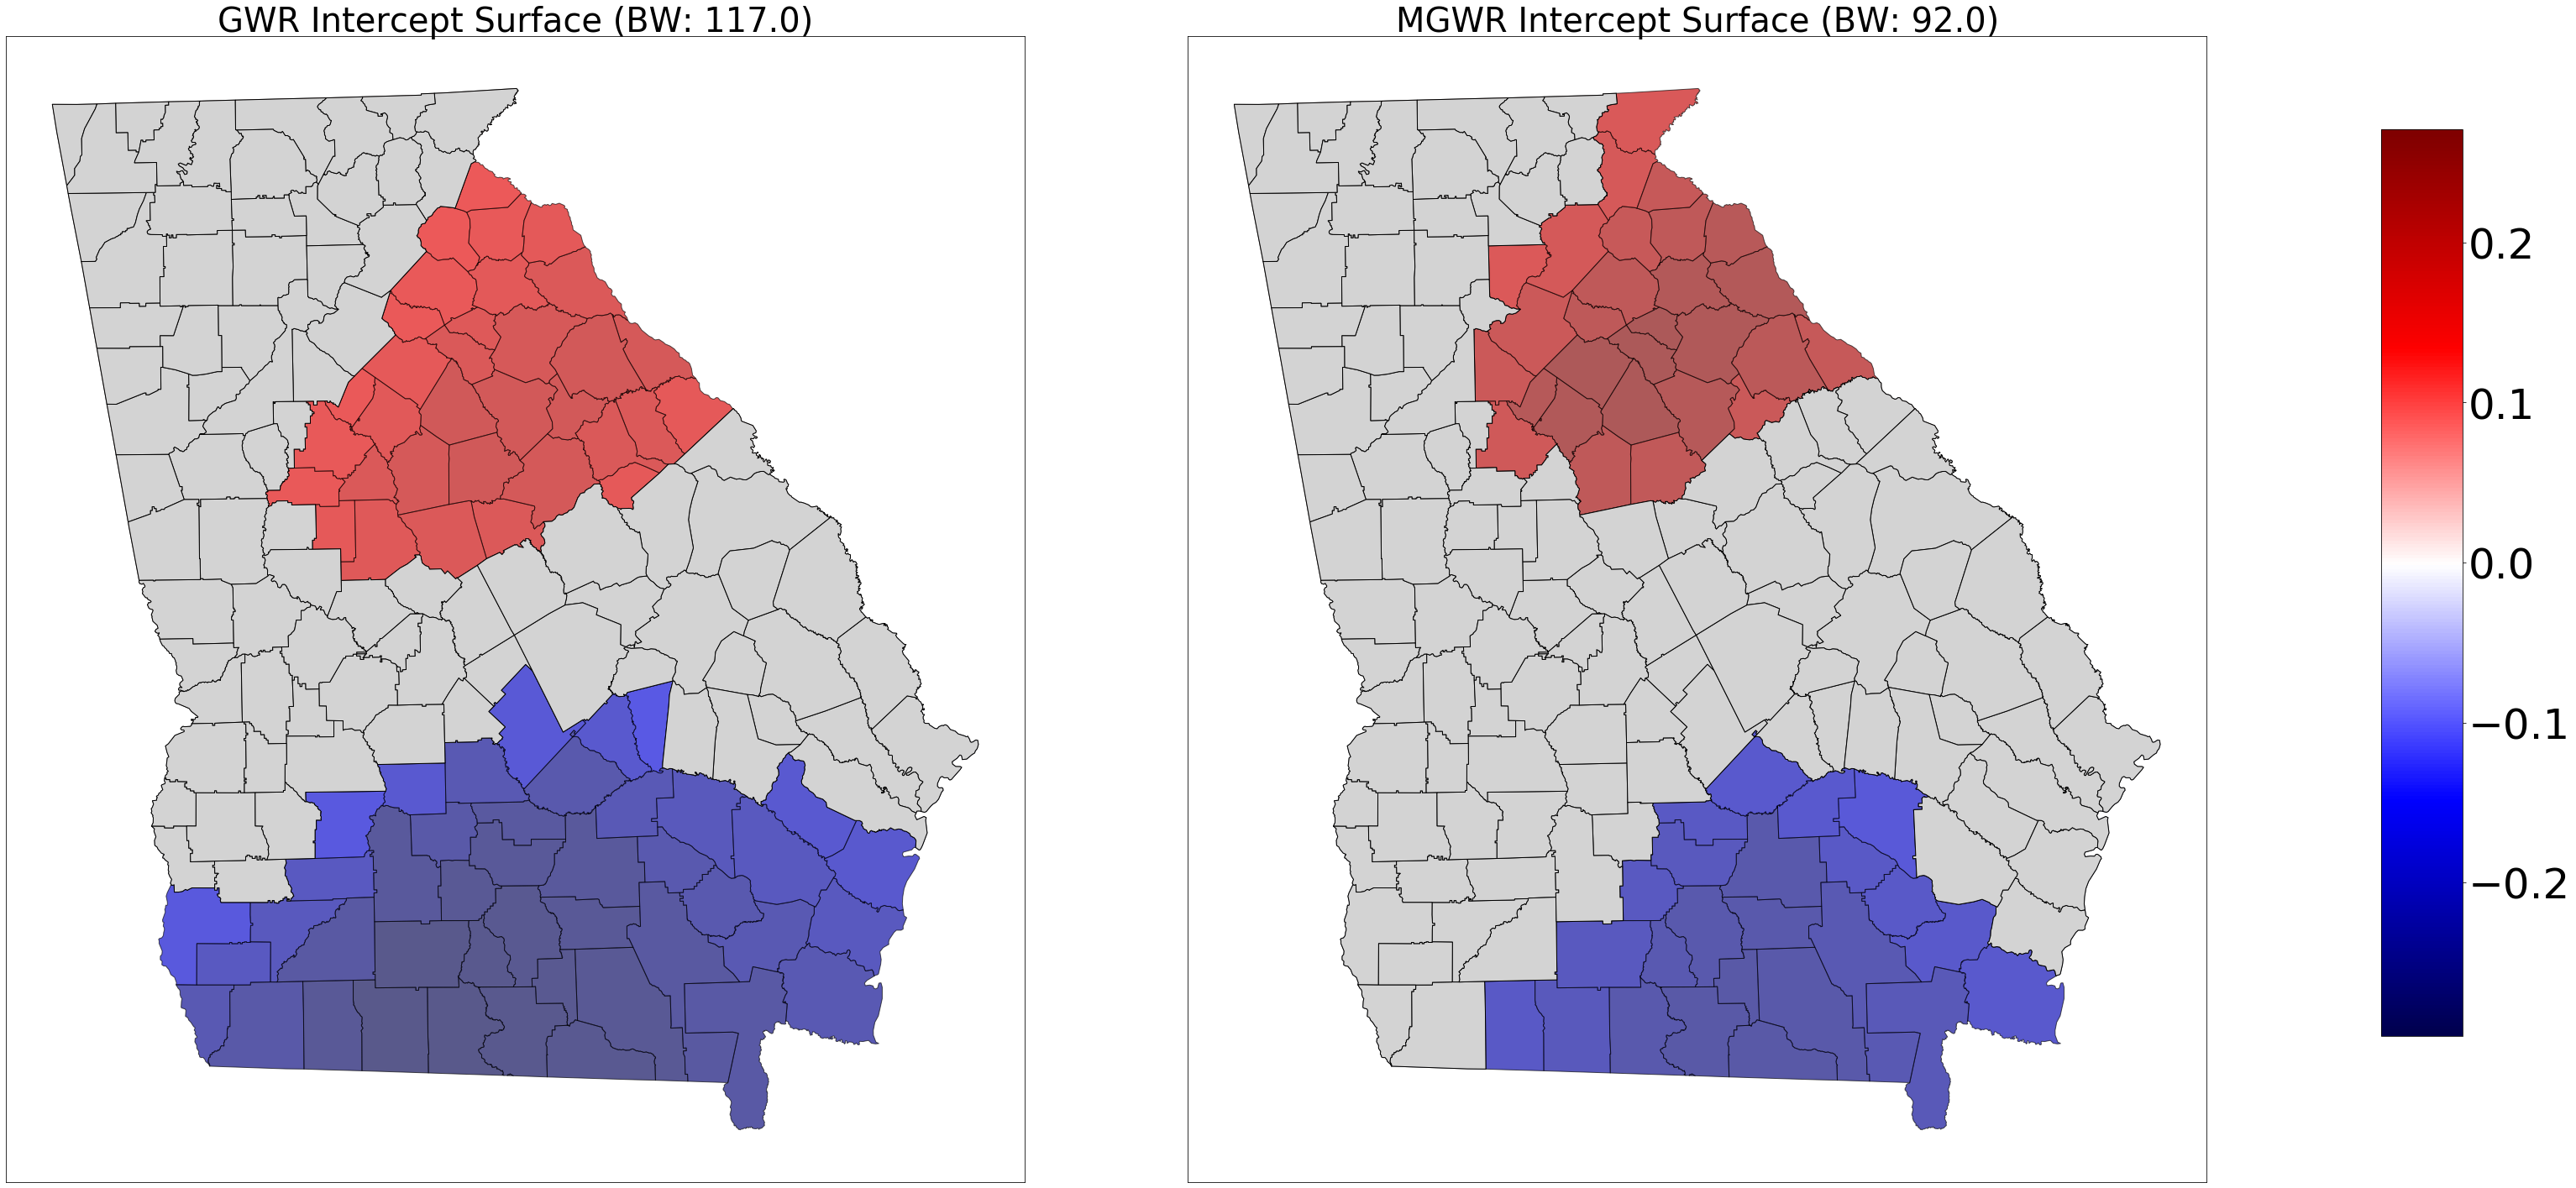
#Comparison maps of GWR vs. MGWR parameter surfaces where the grey units pertain to statistically insignificant parameters

#Prep plot and add axes
fig, axes = plt.subplots(nrows=1, ncols=2, figsize=(45,20))
ax0 = axes[0]
ax0.set_title('GWR Intercept Surface (BW: ' + str(gwr_bw) +')', fontsize=40)
ax1 = axes[1]
ax1.set_title('MGWR Intercept Surface (BW: ' + str(mgwr_bw[0]) +')', fontsize=40)

#Set color map
cmap = plt.cm.seismic

#Find min and max values of the two combined datasets
gwr_min = georgia_shp['gwr_intercept'].min()
gwr_max = georgia_shp['gwr_intercept'].max()
mgwr_min = georgia_shp['mgwr_intercept'].min()
mgwr_max = georgia_shp['mgwr_intercept'].max()
vmin = np.min([gwr_min, mgwr_min])
vmax = np.max([gwr_max, mgwr_max])

#If all values are negative use the negative half of the colormap
if (vmin < 0) & (vmax < 0):
    cmap = truncate_colormap(cmap, 0.0, 0.5)
#If all values are positive use the positive half of the colormap
elif (vmin > 0) & (vmax > 0):
    cmap = truncate_colormap(cmap, 0.5, 1.0)
#Otherwise, there are positive and negative values so the colormap so zero is the midpoint
else:
    cmap = shift_colormap(cmap, start=0.0, midpoint=1 - vmax/(vmax + abs(vmin)), stop=1.)

#Create scalar mappable for colorbar and stretch colormap across range of data values
sm = plt.cm.ScalarMappable(cmap=cmap, norm=plt.Normalize(vmin=vmin, vmax=vmax))

#Plot GWR parameters
georgia_shp.plot('gwr_intercept', cmap=sm.cmap, ax=ax0, vmin=vmin, vmax=vmax, **{'edgecolor':'black', 'alpha':.65})
#If there are insignificnt parameters plot gray polygons over them
if (gwr_filtered_t[:,0] == 0).any():
    georgia_shp[gwr_filtered_t[:,0] == 0].plot(color='lightgrey', ax=ax0, **{'edgecolor':'black'})

#Plot MGWR parameters
georgia_shp.plot('mgwr_intercept', cmap=sm.cmap, ax=ax1, vmin=vmin, vmax=vmax, **{'edgecolor':'black', 'alpha':.65})
#If there are insignificnt parameters plot gray polygons over them
if (mgwr_filtered_t[:,0] == 0).any():
    georgia_shp[mgwr_filtered_t[:,0] == 0].plot(color='lightgrey', ax=ax1, **{'edgecolor':'black'})

#Set figure options and plot
fig.tight_layout()
fig.subplots_adjust(right=0.9)
cax = fig.add_axes([0.92, 0.14, 0.03, 0.75])
sm._A = []
cbar = fig.colorbar(sm, cax=cax)
cbar.ax.tick_params(labelsize=50)
ax0.get_xaxis().set_visible(False)
ax0.get_yaxis().set_visible(False)
ax1.get_xaxis().set_visible(False)
ax1.get_yaxis().set_visible(False)
plt.show()
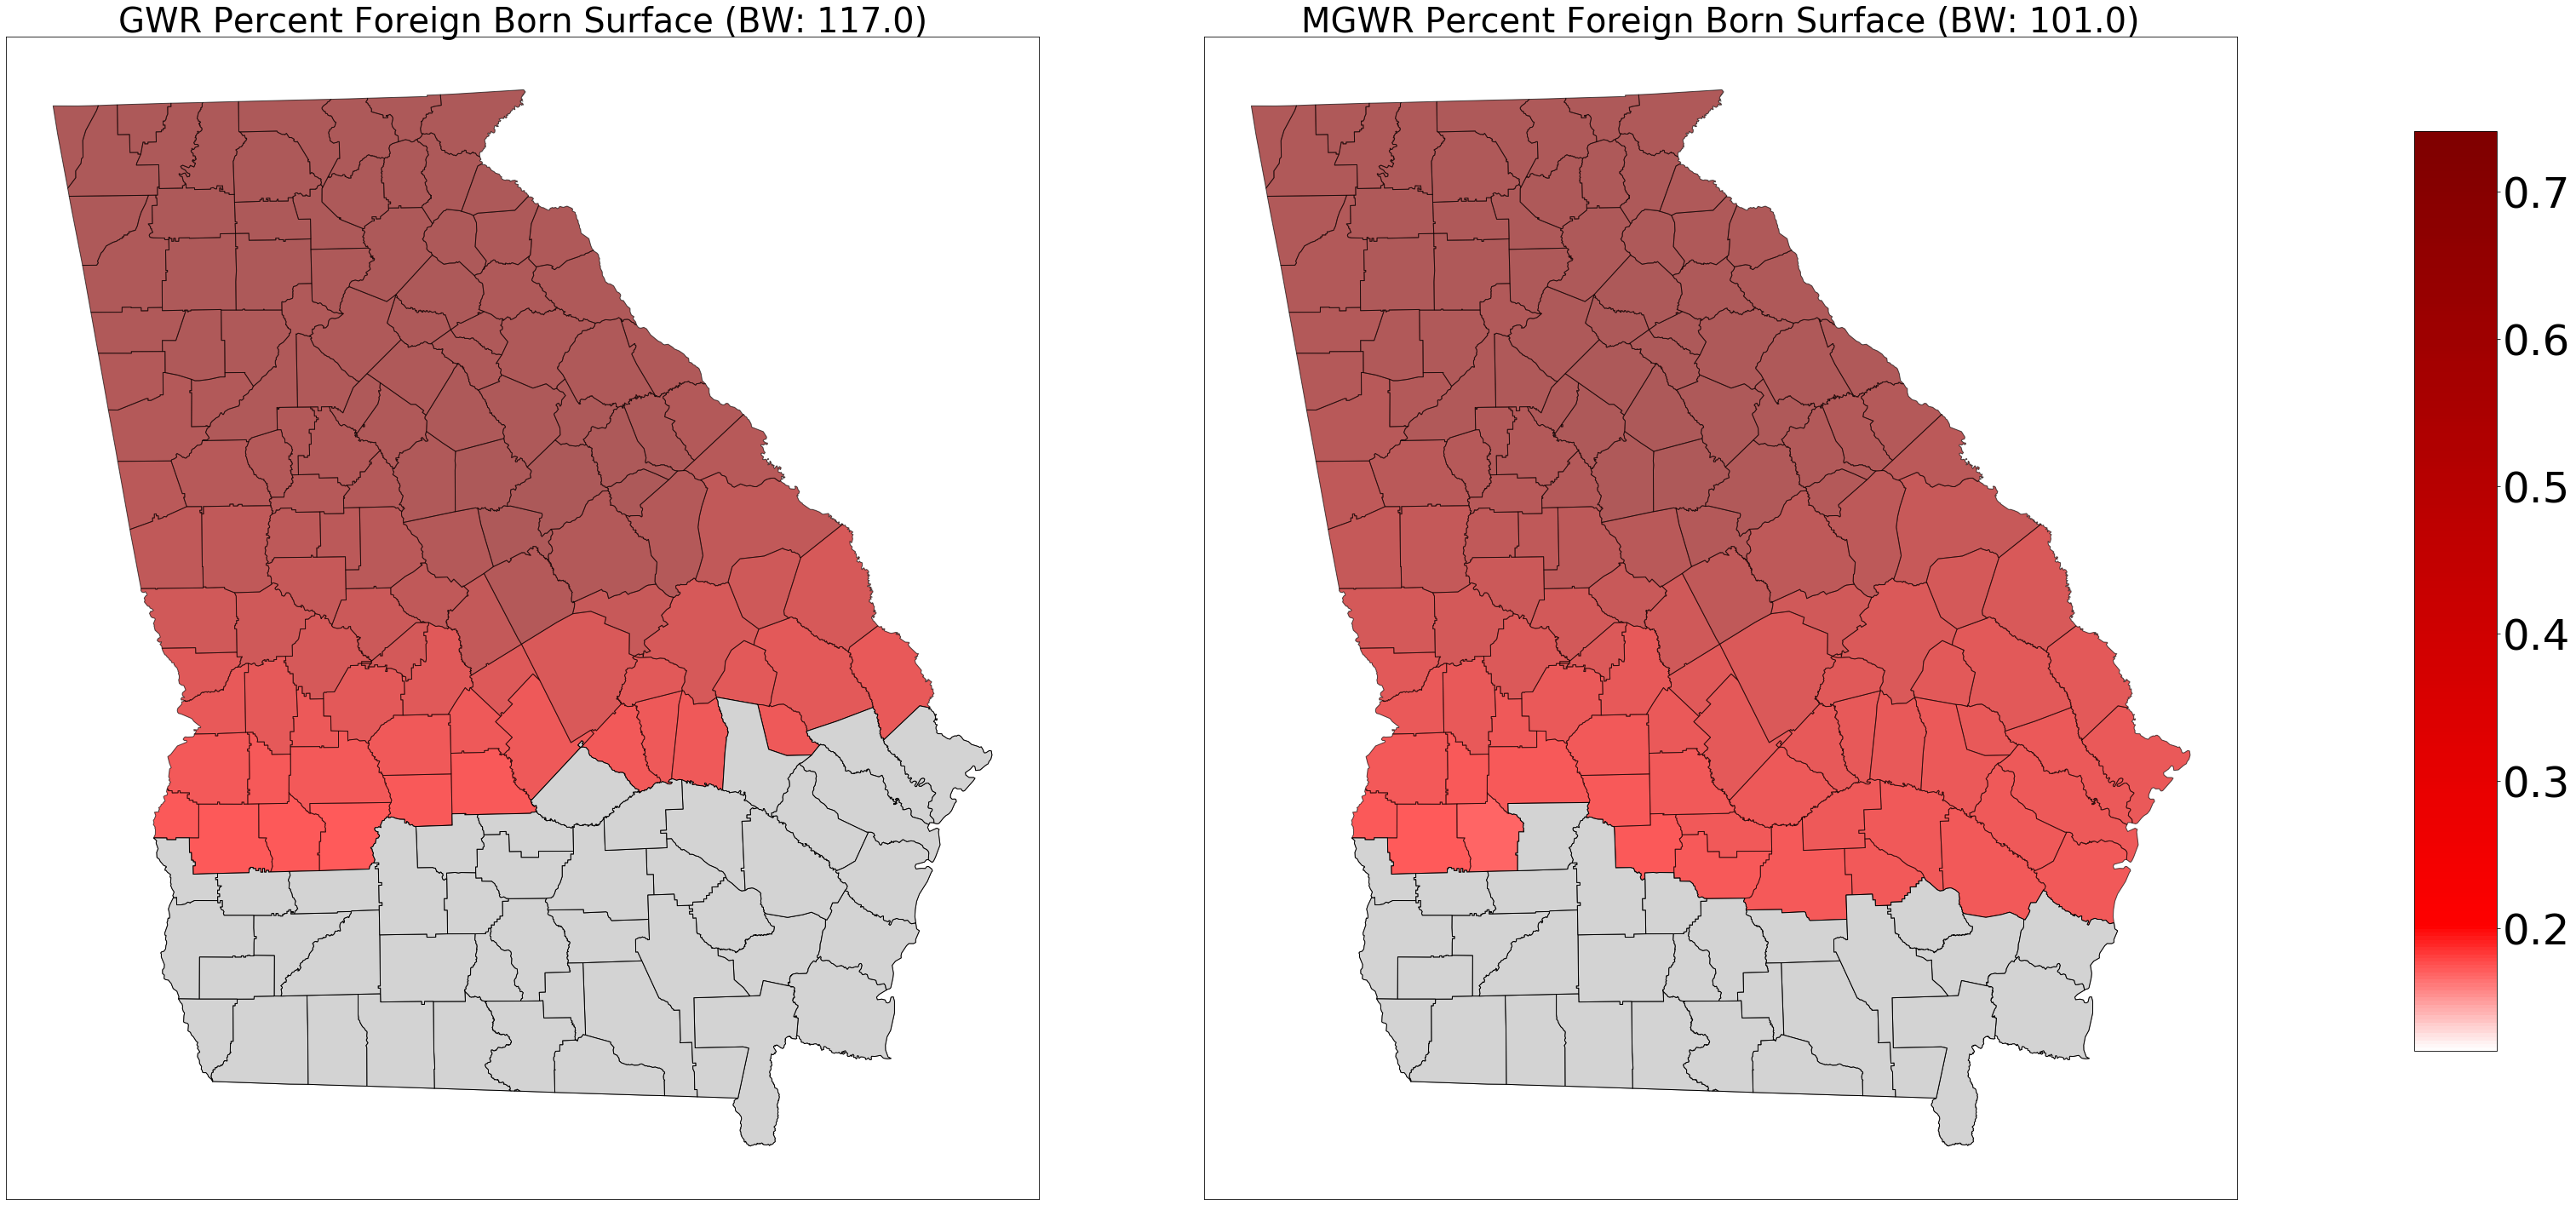
fig, axes = plt.subplots(nrows=1, ncols=2, figsize=(45,20))
ax0 = axes[0]
ax0.set_title('GWR Percent Foreign Born Surface (BW: ' + str(gwr_bw) +')', fontsize=40)
ax1 = axes[1]
ax1.set_title('MGWR Percent Foreign Born Surface (BW: ' + str(mgwr_bw[1]) +')', fontsize=40)
cmap = plt.cm.seismic
gwr_min = georgia_shp['gwr_fb'].min()
gwr_max = georgia_shp['gwr_fb'].max()
mgwr_min = georgia_shp['mgwr_fb'].min()
mgwr_max = georgia_shp['mgwr_fb'].max()
vmin = np.min([gwr_min, mgwr_min])
vmax = np.max([gwr_max, mgwr_max])

if (vmin < 0) & (vmax < 0):
    cmap = truncate_colormap(cmap, 0.0, 0.5)
elif (vmin > 0) & (vmax > 0):
    cmap = truncate_colormap(cmap, 0.5, 1.0)

cmap = shift_colormap(cmap, start=0.0, midpoint=1 - vmax/(vmax + abs(vmin)), stop=1.)

sm = plt.cm.ScalarMappable(cmap=cmap, norm=plt.Normalize(vmin=vmin, vmax=vmax))

georgia_shp.plot('gwr_fb', cmap=sm.cmap, ax=ax0, vmin=vmin, vmax=vmax, **{'edgecolor':'black', 'alpha':.65})
if (gwr_filtered_t[:,1] == 0).any():
    georgia_shp[gwr_filtered_t[:,1] == 0].plot(color='lightgrey', ax=ax0, **{'edgecolor':'black'})

georgia_shp.plot('mgwr_fb', cmap=sm.cmap, ax=ax1, vmin=vmin, vmax=vmax, **{'edgecolor':'black', 'alpha':.65})
if (mgwr_filtered_t[:,1] == 0).any():
    georgia_shp[mgwr_filtered_t[:,1] == 0].plot(color='lightgrey', ax=ax1, **{'edgecolor':'black'})

fig.tight_layout()
fig.subplots_adjust(right=0.9)
cax = fig.add_axes([0.92, 0.14, 0.03, 0.75])
sm._A = []
cbar = fig.colorbar(sm, cax=cax)
cbar.ax.tick_params(labelsize=50)
ax0.get_xaxis().set_visible(False)
ax0.get_yaxis().set_visible(False)
ax1.get_xaxis().set_visible(False)
ax1.get_yaxis().set_visible(False)
plt.show()
fig, axes = plt.subplots(nrows=1, ncols=2, figsize=(45,20))
ax0 = axes[0]
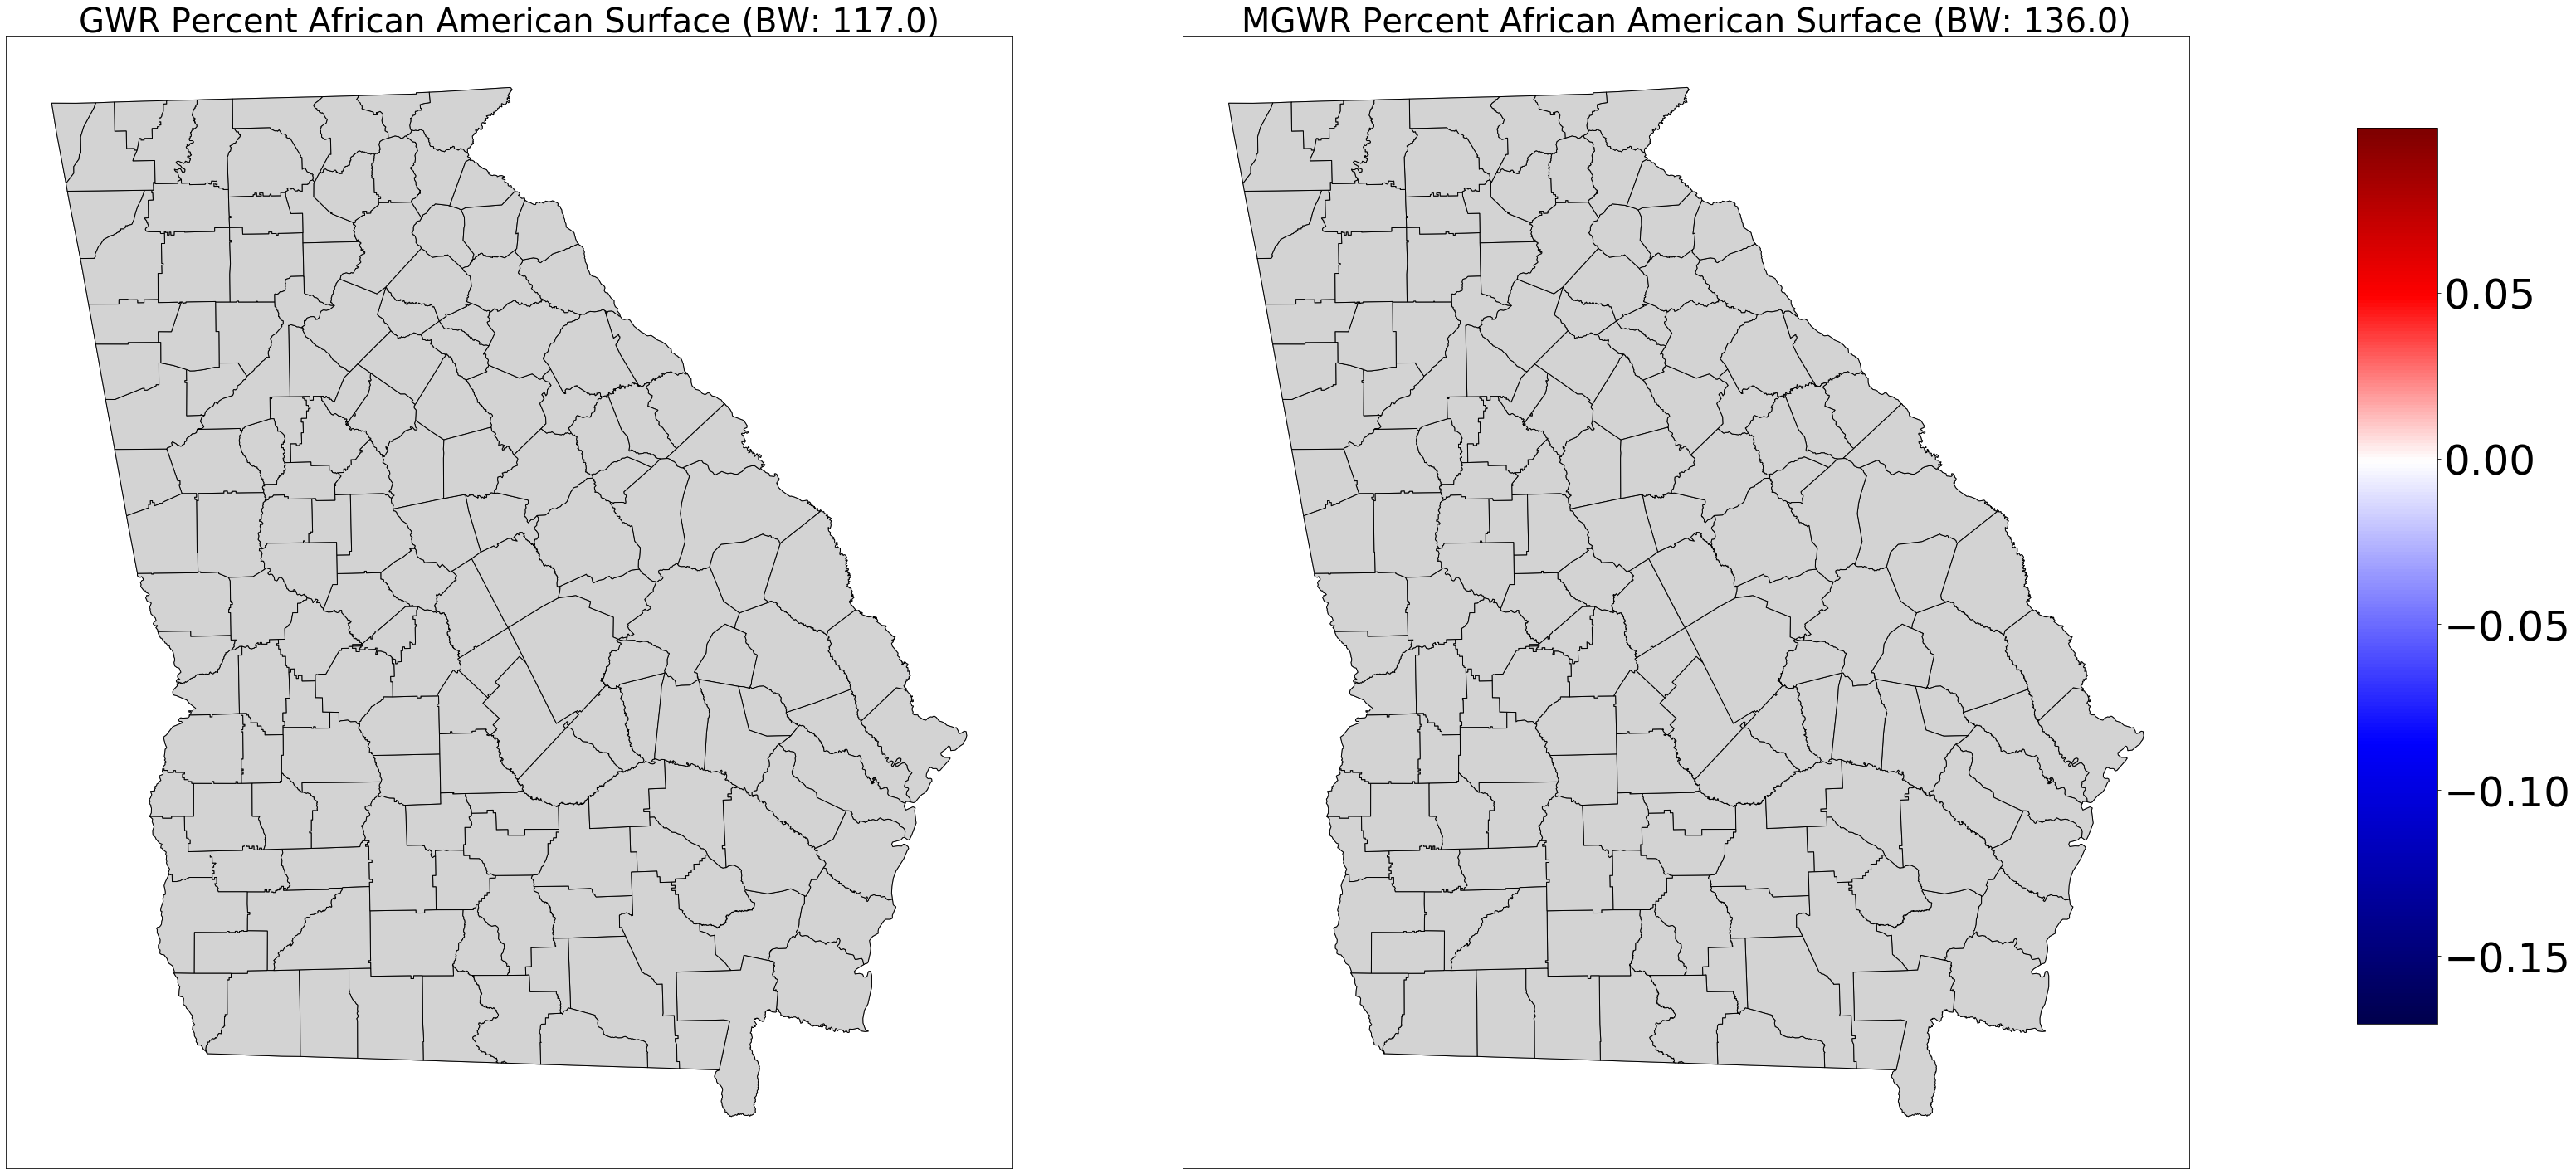
ax0.set_title('GWR Percent African American Surface (BW: ' + str(gwr_bw) +')', fontsize=40)
ax1 = axes[1]
ax1.set_title('MGWR Percent African American Surface (BW: ' + str(mgwr_bw[2]) +')', fontsize=40)
cmap = plt.cm.seismic
gwr_min = georgia_shp['gwr_aa'].min()
gwr_max = georgia_shp['gwr_aa'].max()
mgwr_min = georgia_shp['mgwr_aa'].min()
mgwr_max = georgia_shp['mgwr_aa'].max()
vmin = np.min([gwr_min, mgwr_min])
vmax = np.max([gwr_max, mgwr_max])
if (vmin < 0) & (vmax < 0):
cmap = truncate_colormap(cmap, 0.0, 0.5)
elif (vmin > 0) & (vmax > 0):
cmap = truncate_colormap(cmap, 0.5, 1.0)
else:
cmap = shift_colormap(cmap, start=0.0, midpoint=1 - vmax/(vmax + abs(vmin)), stop=1.)
sm = plt.cm.ScalarMappable(cmap=cmap, norm=plt.Normalize(vmin=vmin, vmax=vmax))
georgia_shp.plot('gwr_aa', cmap=sm.cmap, ax=ax0, vmin=vmin, vmax=vmax, **{'edgecolor':'black', 'alpha':.65})
if (gwr_filtered_t[:,2] == 0).any():
georgia_shp[gwr_filtered_t[:,2] == 0].plot(color='lightgrey', ax=ax0, **{'edgecolor':'black'})
georgia_shp.plot('mgwr_aa', cmap=sm.cmap, ax=ax1, vmin=vmin, vmax=vmax, **{'edgecolor':'black', 'alpha':.65})
if (mgwr_filtered_t[:,2] == 0).any():
georgia_shp[mgwr_filtered_t[:,2] == 0].plot(color='lightgrey', ax=ax1, **{'edgecolor':'black'})
fig.tight_layout()
fig.subplots_adjust(right=0.9)
cax = fig.add_axes([0.92, 0.14, 0.03, 0.75])
sm._A = []
cbar = fig.colorbar(sm, cax=cax)
cbar.ax.tick_params(labelsize=50)
ax0.get_xaxis().set_visible(False)
ax0.get_yaxis().set_visible(False)
ax1.get_xaxis().set_visible(False)
ax1.get_yaxis().set_visible(False)
plt.show()
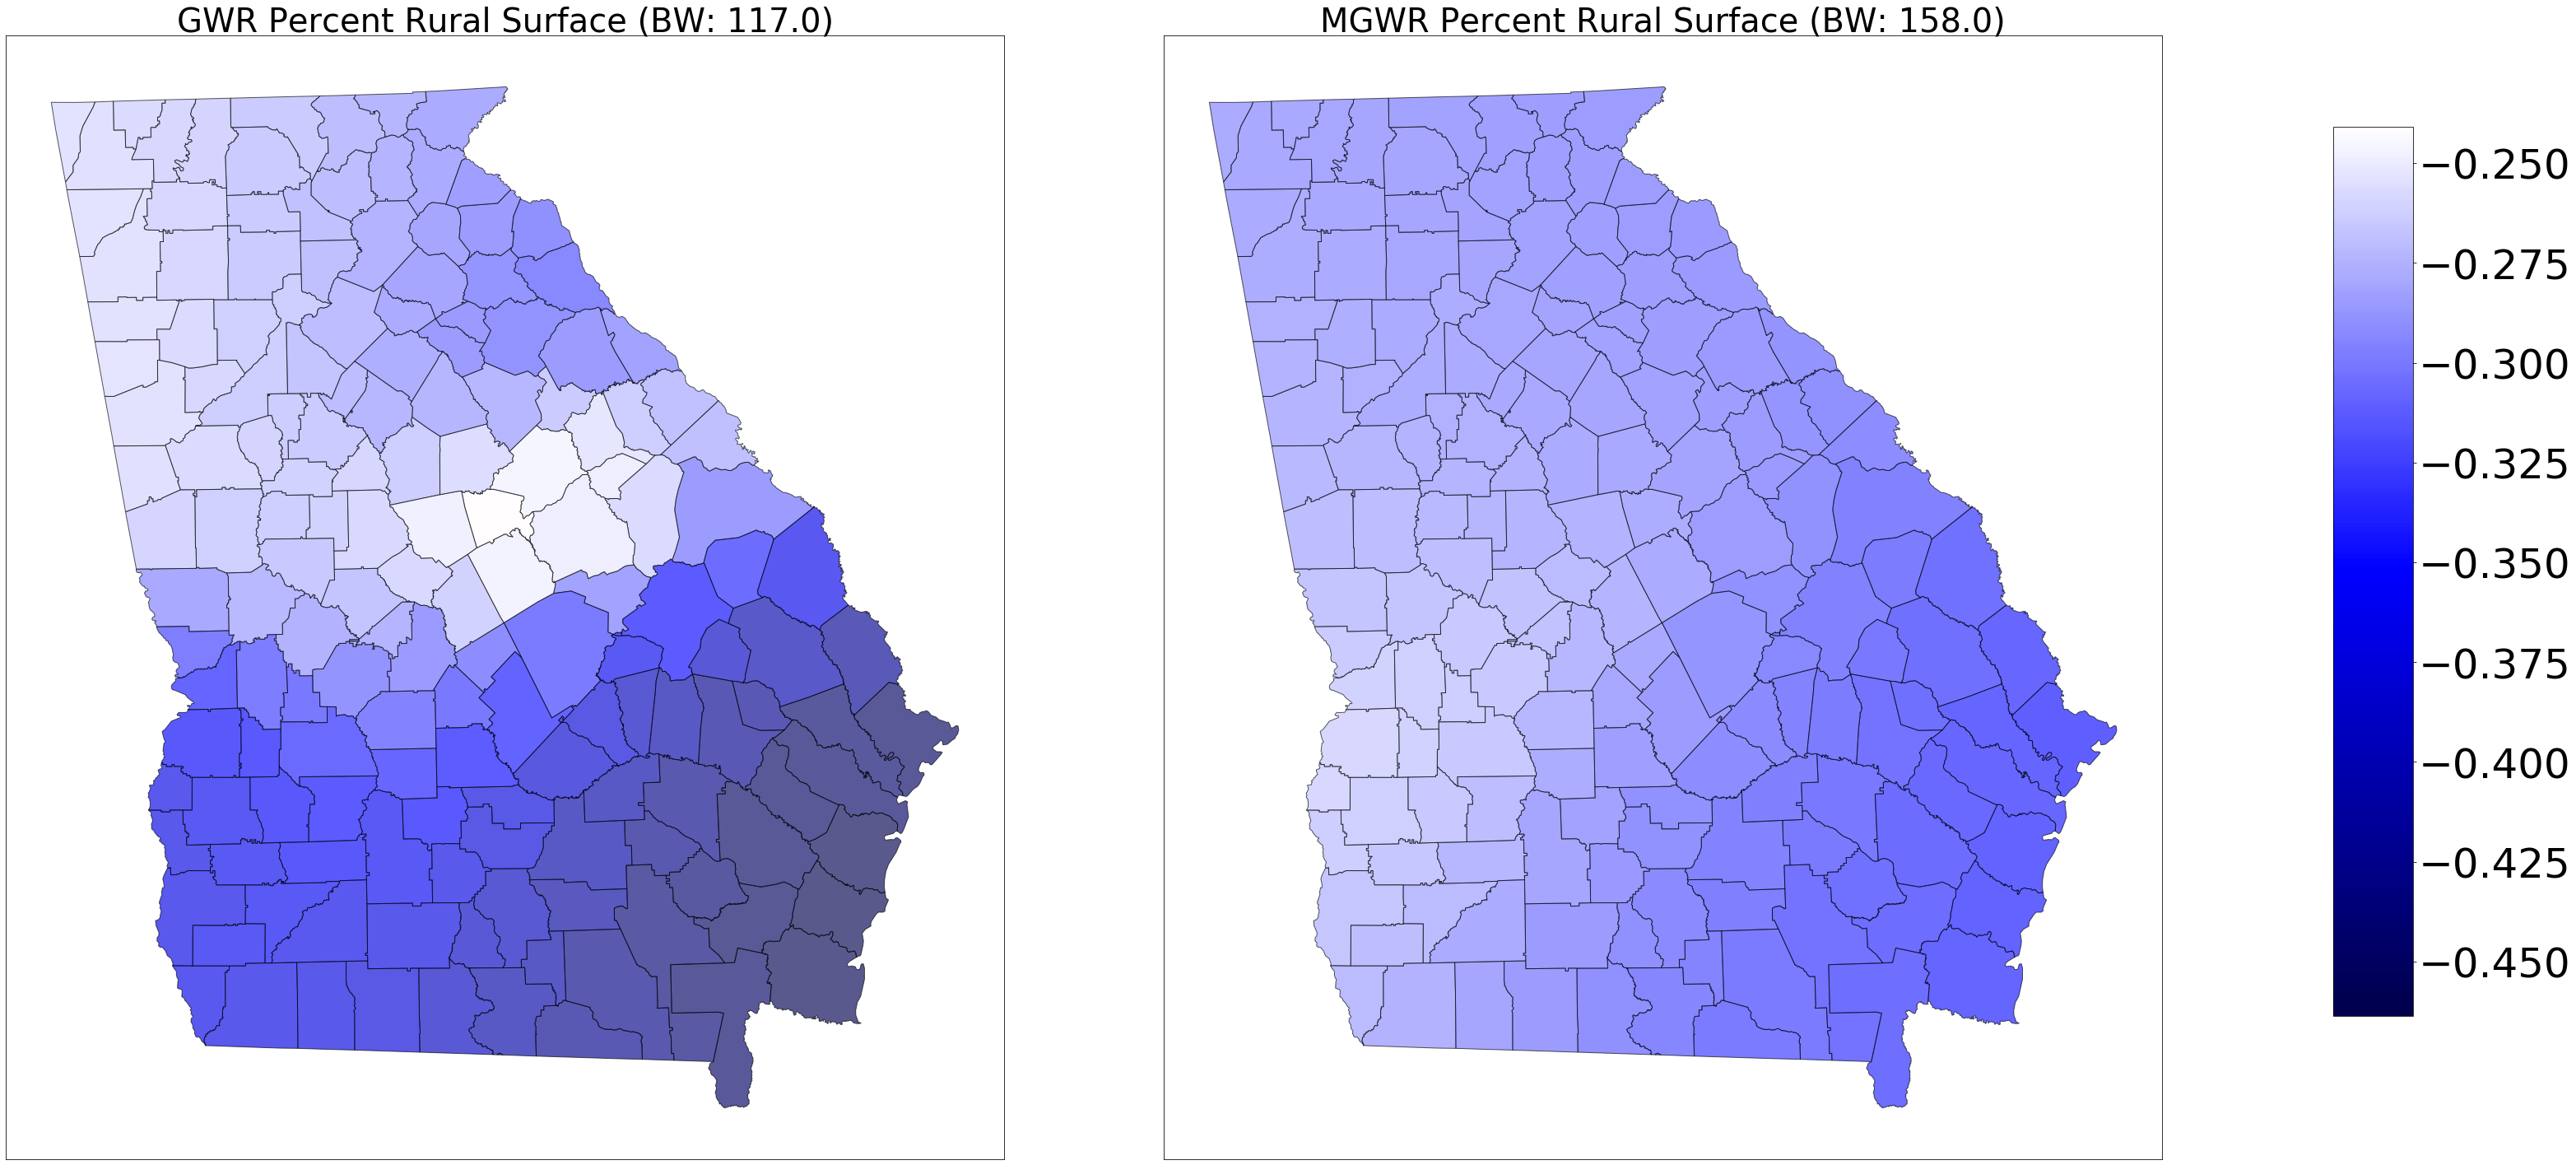
fig, axes = plt.subplots(nrows=1, ncols=2, figsize=(45,20))
ax0 = axes[0]
ax0.set_title('GWR Percent Rural Surface (BW: ' + str(gwr_bw) +')', fontsize=40)
ax1 = axes[1]
ax1.set_title('MGWR Percent Rural Surface (BW: ' + str(mgwr_bw[3]) +')', fontsize=40)
cmap = plt.cm.seismic
gwr_min = georgia_shp['gwr_rural'].min()
gwr_max = georgia_shp['gwr_rural'].max()
mgwr_min = georgia_shp['mgwr_rural'].min()
mgwr_max = georgia_shp['mgwr_rural'].max()
vmin = np.min([gwr_min, mgwr_min])
vmax = np.max([gwr_max, mgwr_max])

if (vmin < 0) & (vmax < 0):
    cmap = truncate_colormap(cmap, 0.0, 0.5)
elif (vmin > 0) & (vmax > 0):
    cmap = truncate_colormap(cmap, 0.5, 1.0)
else:
    cmap = shift_colormap(cmap, start=0.0, midpoint=1 - vmax/(vmax + abs(vmin)), stop=1.)

sm = plt.cm.ScalarMappable(cmap=cmap, norm=plt.Normalize(vmin=vmin, vmax=vmax))

georgia_shp.plot('gwr_rural', cmap=sm.cmap, ax=ax0, vmin=vmin, vmax=vmax, **{'edgecolor':'black', 'alpha':.65})
if (gwr_filtered_t[:,3] == 0).any():
    georgia_shp[gwr_filtered_t[:,3] == 0].plot(color='lightgrey', ax=ax0, **{'edgecolor':'black'})

georgia_shp.plot('mgwr_rural', cmap=sm.cmap, ax=ax1, vmin=vmin, vmax=vmax, **{'edgecolor':'black', 'alpha':.65})
if (mgwr_filtered_t[:,3] == 0).any():
    georgia_shp[mgwr_filtered_t[:,3] == 0].plot(color='lightgrey', ax=ax1, **{'edgecolor':'black'})

fig.tight_layout()
fig.subplots_adjust(right=0.9)
cax = fig.add_axes([0.92, 0.14, 0.03, 0.75])
sm._A = []
cbar = fig.colorbar(sm, cax=cax)
cbar.ax.tick_params(labelsize=50)
ax0.get_xaxis().set_visible(False)
ax0.get_yaxis().set_visible(False)
ax1.get_xaxis().set_visible(False)
ax1.get_yaxis().set_visible(False)
plt.show()