precincts
import tobler
import matplotlib.pyplot as plt
%matplotlib inline
import geopandas
tracts = geopandas.read_file("https://ndownloader.figshare.com/files/20460645")
tracts.shape
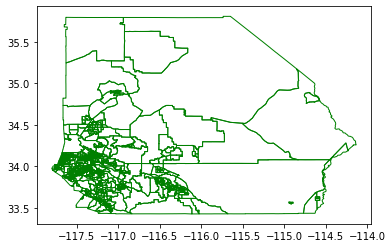
There are 822 tracts in the two counties.
tracts.head()
tracts.plot(facecolor='none', edgecolor='g')
precincts = geopandas.read_file("https://ndownloader.figshare.com/files/20460549")
precincts.shape
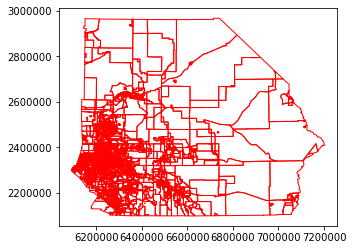
For the 3780 precincts in the two counties, we wish to obtain estimates of the percentage of the population that is youth.
precincts.plot(facecolor='none', edgecolor='r')
estimates = tobler.area_weighted.area_interpolate(tracts, precincts, intensive_variables=['pct Youth'])
Notice the warning about different crs.
estimates
As a result of the different crs, tobler will not carry out the interpolation. We need to fix the crs issue first by setting the tract geometries to use the precincts crs
tracts = tracts.to_crs(precincts.crs)
estimates = tobler.area_weighted.area_interpolate(tracts, precincts, intensive_variables=['pct Youth'])
estimates
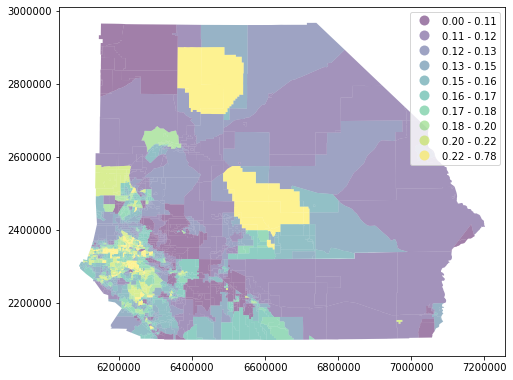
f, ax = plt.subplots(1, figsize=(8, 8))
ax = tracts.plot(column='pct Youth', ax=ax, legend=True, alpha=0.5, scheme='Quantiles', k=10)
plt.show()
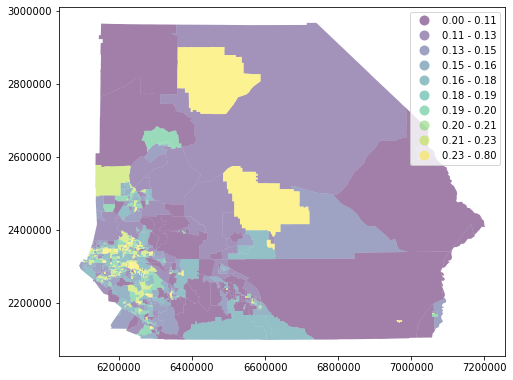
precincts['pct Youth'] = estimates[-1]
f, ax = plt.subplots(1, figsize=(8, 8))
ax = precincts.plot(column='pct Youth', ax=ax, legend=True, alpha=0.5, scheme='Quantiles', k=10)
plt.show()