This page was generated from notebooks/pointpattern-attributes.ipynb.
Interactive online version:
![]()
If any part of this notebook is used in your research, please cite with the reference found in README.md.
Network point pattern attributes
Demonstrating network point pattern representation
Author: James D. Gaboardi jgaboardi@gmail.com
This notebook is an basic walk-through for:
Exploring the attributes of network objects and point patterns
Generating observation counts per network link
Simulating a point pattern
[1]:
%config InlineBackend.figure_format = "retina"
[2]:
%load_ext watermark
%watermark
Last updated: 2022-11-01T23:20:22.812220-04:00

Python implementation: CPython
Python version       : 3.10.6
IPython version      : 8.6.0

Compiler    : Clang 13.0.1
OS          : Darwin
Release     : 22.1.0
Machine     : x86_64
Processor   : i386
CPU cores   : 8
Architecture: 64bit
[3]:
import geopandas
import libpysal
import matplotlib
import matplotlib_scalebar
from matplotlib_scalebar.scalebar import ScaleBar
import numpy
import pandas
import shapely
from shapely.geometry import Point
import spaghetti

%matplotlib inline
%watermark -w
%watermark -iv
Watermark: 2.3.1

shapely            : 1.8.5.post1
matplotlib_scalebar: 0.8.0
json               : 2.0.9
geopandas          : 0.12.1
matplotlib         : 3.6.1
libpysal           : 4.6.2
numpy              : 1.23.4
pandas             : 1.5.1
spaghetti          : 1.6.8
/Users/the-gaboardi/miniconda3/envs/py310_spgh_dev/lib/python3.10/site-packages/spaghetti/network.py:39: FutureWarning: The next major release of pysal/spaghetti (2.0.0) will drop support for all ``libpysal.cg`` geometries. This change is a first step in refactoring ``spaghetti`` that is expected to result in dramatically reduced runtimes for network instantiation and operations. Users currently requiring network and point pattern input as ``libpysal.cg`` geometries should prepare for this simply by converting to ``shapely`` geometries.
  warnings.warn(f"{dep_msg}", FutureWarning)
Instantiating a spaghetti.Network object
Instantiate the network from a .shp file
[4]:
ntw = spaghetti.Network(in_data=libpysal.examples.get_path("streets.shp"))
1. Allocating observations (snapping points) to a network:
A network is composed of a single topological representation of network elements (arcs and vertices) to which point patterns may be snapped.
[5]:
pp_name = "crimes"
pp_shp = libpysal.examples.get_path("%s.shp" % pp_name)
ntw.snapobservations(pp_shp, pp_name, attribute=True)
ntw.pointpatterns
[5]:
{'crimes': <spaghetti.network.PointPattern at 0x15a02d1e0>}
Attributes for every point pattern
dist_snappeddict keyed by point id with the value as snapped distance from observation to network arc
[6]:
ntw.pointpatterns[pp_name].dist_snapped[0]
[6]:
221.58676169738433
dist_to_vertexdict keyed by pointid with the value being a dict in the form {node: distance to vertex, node: distance to vertex}
[7]:
ntw.pointpatterns[pp_name].dist_to_vertex[0]
[7]:
{161: 83.70599311338093, 162: 316.8274480625799}
npointspoint observations in set
[8]:
ntw.pointpatterns[pp_name].npoints
[8]:
287
obs_to_arcdict keyed by arc with the value being a dict in the form {pointID:(x-coord, y-coord), pointID:(x-coord, y-coord), … }
[9]:
ntw.pointpatterns[pp_name].obs_to_arc[(161, 162)]
[9]:
{0: (727919.2473619275, 875942.4986759046)}
obs_to_vertexlist of incident network vertices to snapped observation points
[10]:
ntw.pointpatterns[pp_name].obs_to_vertex[0]
[10]:
161
pointsgeojson like representation of the point pattern. Includes properties if read with attributes=True
[11]:
ntw.pointpatterns[pp_name].points[0]
[11]:
{'coordinates': (727913.0000000029, 875720.9999999977), 'properties': [[1, 1]]}
snapped_coordinatesdict keyed by pointid with the value being (x-coord, y-coord)
[12]:
ntw.pointpatterns[pp_name].snapped_coordinates[0]
[12]:
(727919.2473619275, 875942.4986759046)
2. Counts per link
Counts per link (arc or edge) are important, but should not be precomputed since there are spatial and graph representations.
[13]:
def fetch_cpl(net, pp, mean=True):
    """Create a counts per link object and find mean."""
    cpl = net.count_per_link(net.pointpatterns[pp].obs_to_arc, graph=False)
    if mean:
        mean_cpl = sum(list(cpl.values())) / float(len(cpl.keys()))
        return cpl, mean_cpl
    return cpl
[14]:
ntw_counts, ntw_ctmean = fetch_cpl(ntw, pp_name)
list(ntw_counts.items())[:4]
[14]:
[((161, 162), 1), ((157, 158), 3), ((162, 163), 2), ((160, 161), 2)]
[15]:
ntw_ctmean
[15]:
2.682242990654206
3. Simulate a point pattern on the network
The number of points must supplied.
The only distribution currently supported is uniform.
Generally, this will not be called by the user since the simulation will be used for Monte Carlo permutation.
[16]:
npts = ntw.pointpatterns[pp_name].npoints
npts
[16]:
287
[17]:
sim_uniform = ntw.simulate_observations(npts)
sim_uniform
[17]:
<spaghetti.network.SimulatedPointPattern at 0x15a133430>
[18]:
print(dir(sim_uniform))
['__class__', '__delattr__', '__dict__', '__dir__', '__doc__', '__eq__', '__format__', '__ge__', '__getattribute__', '__gt__', '__hash__', '__init__', '__init_subclass__', '__le__', '__lt__', '__module__', '__ne__', '__new__', '__reduce__', '__reduce_ex__', '__repr__', '__setattr__', '__sizeof__', '__str__', '__subclasshook__', '__weakref__', 'dist_to_vertex', 'npoints', 'obs_to_arc', 'obs_to_vertex', 'points', 'snapped_coordinates']
Extract the simulated points along the network a geopandas.GeoDataFrame
[19]:
def as_gdf(pp):
    pp = {idx: Point(coords) for idx, coords in pp.items()}
    gdf = geopandas.GeoDataFrame(index=pp.keys(), geometry=list(pp.values()))
    gdf.index.name = "id"
    return gdf

sim_uniform_gdf = as_gdf(sim_uniform.points)
sim_uniform_gdf.head()
[19]:
| geometry | |
|---|---|
| id | |
| 0 | POINT (728015.697 880267.678) |
| 1 | POINT (728344.044 880950.479) |
| 2 | POINT (725243.339 877003.470) |
| 3 | POINT (726796.750 877154.569) |
| 4 | POINT (728270.813 876219.812) |
Create geopandas.GeoDataFrame objects of the vertices and arcs
[20]:
vertices_df, arcs_df = spaghetti.element_as_gdf(
    ntw, vertices=ntw.vertex_coords, arcs=ntw.arcs
)
Create geopandas.GeoDataFrame objects of the actual and snapped crime locations
[21]:
crimes = spaghetti.element_as_gdf(ntw, pp_name=pp_name)
crimes_snapped = spaghetti.element_as_gdf(ntw, pp_name=pp_name, snapped=True)
Helper plotting function
[22]:
def plotter():
"""Generate a spatial plot."""
def _patch(_kws, labinfo):
"""Generate a legend patch."""
label = "%s — %s" % tuple(labinfo)
_kws.update({"lw":0, "label":label, "alpha":.5})
return matplotlib.lines.Line2D([], [], **_kws)
def _legend(handles, anchor=(1., .75)):
"""Generate a legend."""
lkws = {"fancybox":True,"framealpha":0.85, "fontsize":"xx-large"}
lkws.update({"bbox_to_anchor": anchor, "labelspacing": 2.})
lkws.update({"borderpad": 2., "handletextpad":1.5})
lkws.update({"title": "Crime locations & counts", "title_fontsize":25})
matplotlib.pyplot.legend(handles=handles, **lkws)
def carto_elements(b):
"""Add/adjust cartographic elements."""
kw = {"units":"ft", "dimension":"imperial-length", "fixed_value":1000}
b.add_artist(ScaleBar(1, **kw))
b.set(xticklabels=[], xticks=[], yticklabels=[], yticks=[]);
pkws = {"alpha":0.25}
base = arcs_df.plot(color="k", figsize=(9, 9), zorder=0, **pkws)
patches = []
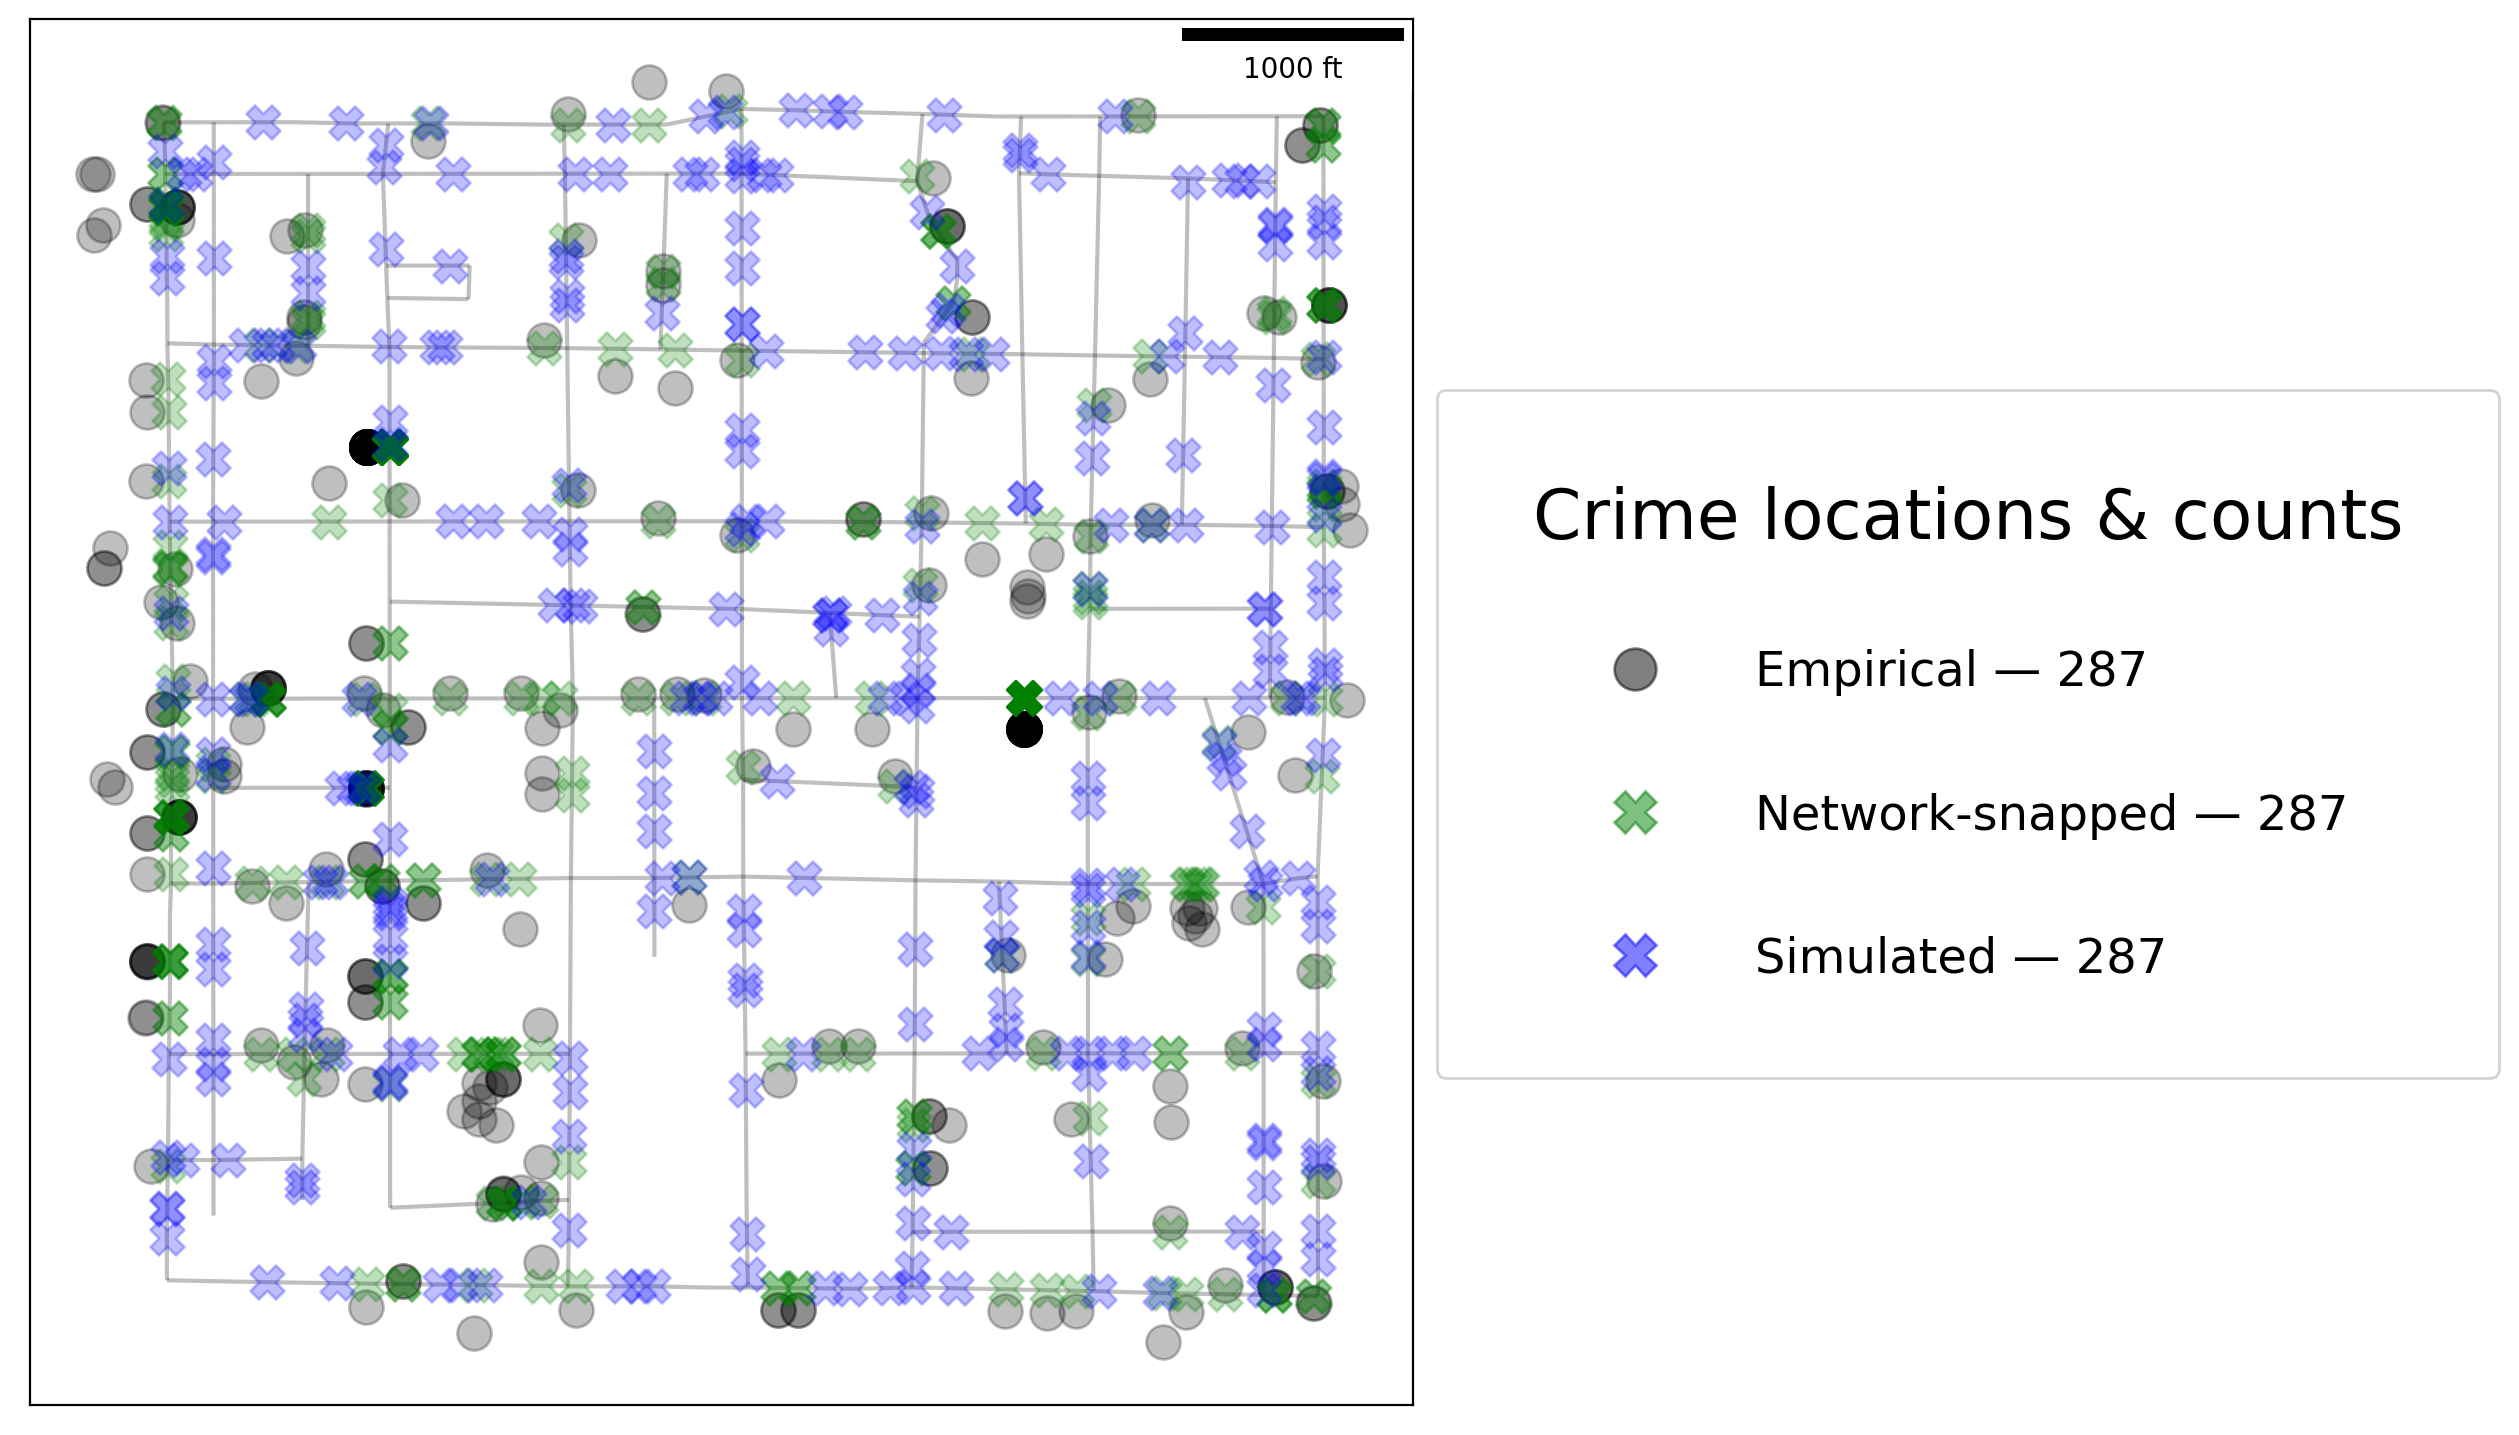
gdfs = [crimes, crimes_snapped, sim_uniform_gdf]
colors, zo = ["k", "g", "b"], [1 ,2 ,3]
markers, markersizes = ["o", "X", "X"], [150, 150, 150]
labels = [["Empirical"], ["Network-snapped"], ["Simulated"]]
iterinfo = list(zip(gdfs, colors, zo, markers, markersizes, labels))
for gdf, c, z, m, ms, lab in iterinfo:
gdf.plot(ax=base, c=c, marker=m, markersize=ms, zorder=z, **pkws)
patch_args = {"marker":m, "markersize":ms/10,"c":c}, lab+[gdf.shape[0]]
patches.append(_patch(*patch_args))
_legend(patches)
carto_elements(base)
Crimes: empirical, network-snapped, and simulated locations
[23]:
plotter()