import rasterio
import numpy
import pandas
import geopandas
import matplotlib.pyplot as plt
%matplotlib inline
Read in the austinlights.tif file we made in the rasters notebook
nightlight_file = rasterio.open('../data/austinlights.tif')
nightlights = nightlight_file.read(1)
Make a nightlights_extent array containing the extent of the nightlight raster.
the bounds attribute from the nightlight_file will be helpful.
nightlight_extent = numpy.asarray(nightlight_file.bounds)[[0,2,1,3]]
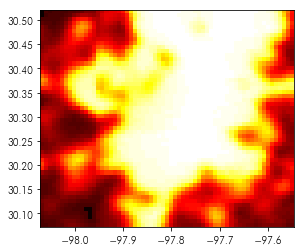
plt.imshow(nightlights, cmap='hot', extent=nightlight_extent)
Read in the Ausin 311 data
reports = pandas.read_csv('../data/austin_311.csv.gz')
Clean the 311 data:
- This time, we’ll simply ignore the missing points. Drop the values with missing
latitude,longitude, orlocationattributes. - Keep only tickets whose
statussuggests they’re reports with full information that are not duplicated. - Remove impossible latitude/longitudes using the
nightlight_extentyou made earlier.
reports = reports.dropna(subset=['longitude', 'latitude', 'location'])
to_drop = ('Duplicate (closed)', 'Closed -Incomplete Information', 'Duplicate (open)',
           'TO BE DELETED', 'CancelledTesting', 'Closed -Incomplete', 'Incomplete')
reports = reports.query('status not in @to_drop')
too_far_ns = (reports.latitude < nightlight_extent[2]) | (reports.latitude > nightlight_extent[3])
too_far_we = (reports.longitude < nightlight_extent[0]) | (reports.longitude > nightlight_extent[1])
outside = too_far_ns | too_far_we
reports = reports[~outside]
Make a geodataframe from the reports data
reports = geopandas.GeoDataFrame(reports,
                                 geometry=geopandas.points_from_xy(reports.longitude,
                                                                   reports.latitude))
Identify whether your zipcodes are accurately coded
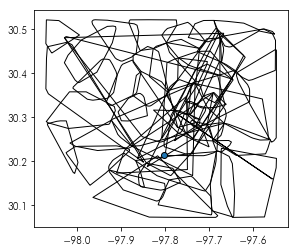
- First, build a convex hull around points within the same area
- Then, plot the convex hulls to see if they overlap/make sense.
zipcodes = reports.groupby('zipcode').geometry\
                  .apply(lambda x: x.unary_union.convex_hull)
zipcodes = geopandas.GeoDataFrame(zipcodes)
zipcodes.plot(ax=plt.gca(), facecolor='none', edgecolor='k')
What is the highest, lowest, and median brightness within these three zipcodes?
- 78705
- 78702
- 78701
plt.figure(figsize=(10,10))
zipcodes.loc[[78705, 78702, 78701]].plot(ax=plt.gca(), facecolor='none', edgecolor='k')
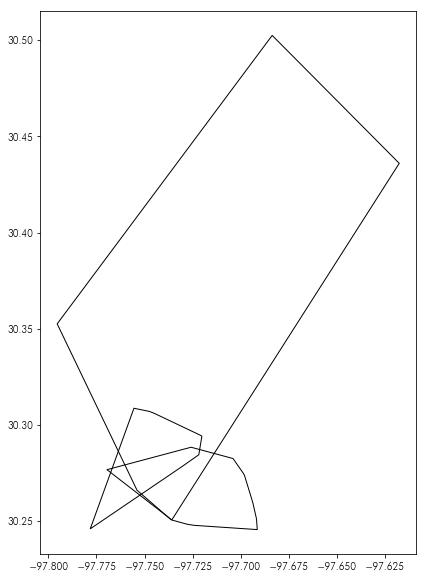
targets = zipcodes.loc[[78705, 78702, 78701]]
from rasterio.mask import mask
def summarize_mask(geom, dataset=nightlight_file, **mask_kw):
    mask_kw.setdefault('crop', True)
    mask_kw.setdefault('filled', False)
    masked = mask(dataset=dataset, shapes=(geom,), **mask_kw)[0]
    return (masked.min(), numpy.ma.median(masked), masked.max())
targets.geometry.apply(summarize_mask)
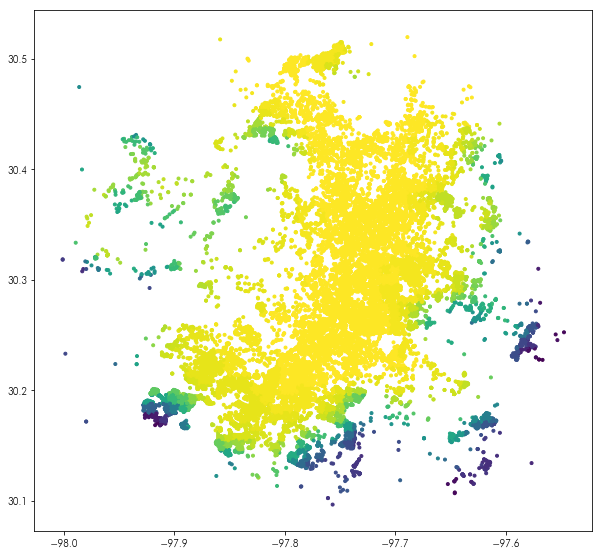
What is the brightness at each of the streetlight issues in the 311 dataset?
streetlight_issues = reports.description.apply(lambda string: ('street light' in string.lower()))
streetlight_reports = reports[streetlight_issues]
brightnesses = nightlight_file.sample(streetlight_reports[['longitude', 'latitude']].values)
brightnesses = numpy.hstack(list(brightnesses))
plt.figure(figsize=(10,10))
streetlight_reports.assign(brightness=brightnesses).plot('brightness', ax=plt.gca(), marker='.')
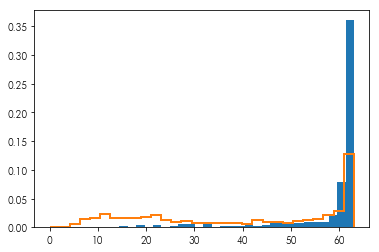
plt.hist(brightnesses, bins=30, density=True)
plt.hist(nightlights.flatten(), density=True,
         bins=30, histtype='step', linewidth=2)