import pandas
import numpy
import geopandas
import matplotlib.pyplot as plt
import geopy
%matplotlib inline
Read in the Austin 311 data
It’s in the data folder, called austin_311.
reports = pandas.read_csv('../data/austin_311.csv.gz')
reports.head()
What are the 10 most common types of events in the data?
reports.groupby('type_code').type_code.count().sort_values(ascending=False).head(10)
Fixing missing latitude/longitude values
- how many records have a missing latitude/longitude pair?
- using the
locationfield and the geocoding tools we discussed before, create latitude/longitude pairs for the records with missinglatitudeandlongitudevalues. - update your dataframe with the new geocoded
longitudeandlatitudevalues. - show that there is no missing latitude/longitude values in the updated data.
missing_coordinates = reports.latitude.isnull() | reports.longitude.isnull()
missing_coordinates.sum()
import geopy
coder = geopy.Nominatim(user_agent='scipy2019-intermediate-gds')
def latlng(address):
    coded = coder.geocode(address)
    return coded.latitude, coded.longitude
reports[missing_coordinates].location
locations = reports[missing_coordinates].location.apply(latlng).apply(pandas.Series)
reports.loc[missing_coordinates, 'latitude'] = locations[0]
reports.loc[missing_coordinates, 'longitude'] = locations[1]
reports.latitude.isnull().any() | reports.longitude.isnull().any()
Fixing missing addresses
- how many records are missing
locationfield entries? - using the
latitudeandlongitudefields, find the street locations for the records with missinglocationvalues. - update your dataframe with the new
locationvalues. (BONUS: Update thestreet_number,street_name, andzipcodeif you can, too) - show that there are no more missing
locationvalues in your data.
missing_locations = reports.location.isnull()
missing_locations.sum()
def reverse(coordinate):
    return coder.reverse(coordinate).address
locations = reports.loc[missing_locations,['latitude','longitude']].apply(reverse, axis=1)
locations
reports.loc[missing_locations, ['location']] = locations
def maybe_get_first_number(splitstring):
    try:
        return int(splitstring[0])
    except ValueError:
        return numpy.nan
street_numbers = locations.str.split(',').apply(maybe_get_first_number)
def maybe_get_streetname(splitstring):
    try:
        int(splitstring[0])
        return splitstring[1]
    except ValueError:
        return splitstring[0]
street_names = locations.str.split(',').apply(maybe_get_streetname)
street_names
zipcodes = locations.str.split(',').apply(lambda split: split[-2])
zipcodes
reports.loc[missing_locations, ['street_number']] = street_numbers
reports.loc[missing_locations, ['street_name']] = street_names
reports.loc[missing_locations, ['zipcode']] = zipcodes
reports.location.isnull().any()
Check miscoded latitude, longitude values.
Use the total bounds of the austin neighborhoods data to identify observations that may be mis-coded as outside of Austin.
neighborhoods = geopandas.read_file('../data/neighborhoods.gpkg')
known_bounds = neighborhoods.total_bounds
known_bounds
too_far_ns = (reports.latitude < known_bounds[1]) | (reports.latitude > known_bounds[3])
too_far_we = (reports.longitude < known_bounds[0]) | (reports.longitude > known_bounds[2])
outside = too_far_ns | too_far_we
outside.sum()
reports = reports[~outside]
Remove duplicate reports
311 data is very dirty. Let’s keep only tickets whose status suggests they’re reports with full information that are not duplicated.
reports.status.unique()
to_drop = ('Duplicate (closed)', 'Closed -Incomplete Information', 'Duplicate (open)',
           'TO BE DELETED', 'CancelledTesting', 'Closed -Incomplete', 'Incomplete')
reports = reports.query('status not in @to_drop')
reports.status.unique()
Build a GeoDataFrame from the locations
reports = geopandas.GeoDataFrame(reports, geometry=geopandas.points_from_xy(reports.longitude,
                                                                            reports.latitude))
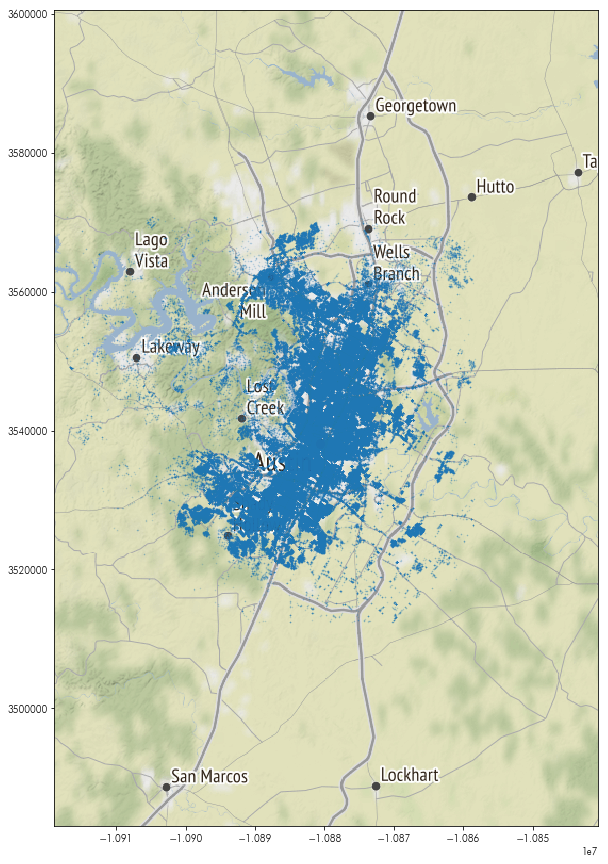
Make a map of the report instances with a basemap
import contextily
reports.crs = {'init':'epsg:4326'}
reports = reports.to_crs(epsg=3857)
basemap, basemap_extent = contextily.bounds2img(*reports.total_bounds, zoom=10, ll=False)
plt.figure(figsize=(15,15))
plt.imshow(basemap, extent=basemap_extent)
reports.plot(ax=plt.gca(), marker='.', markersize=1, alpha=.25)
reports.shape
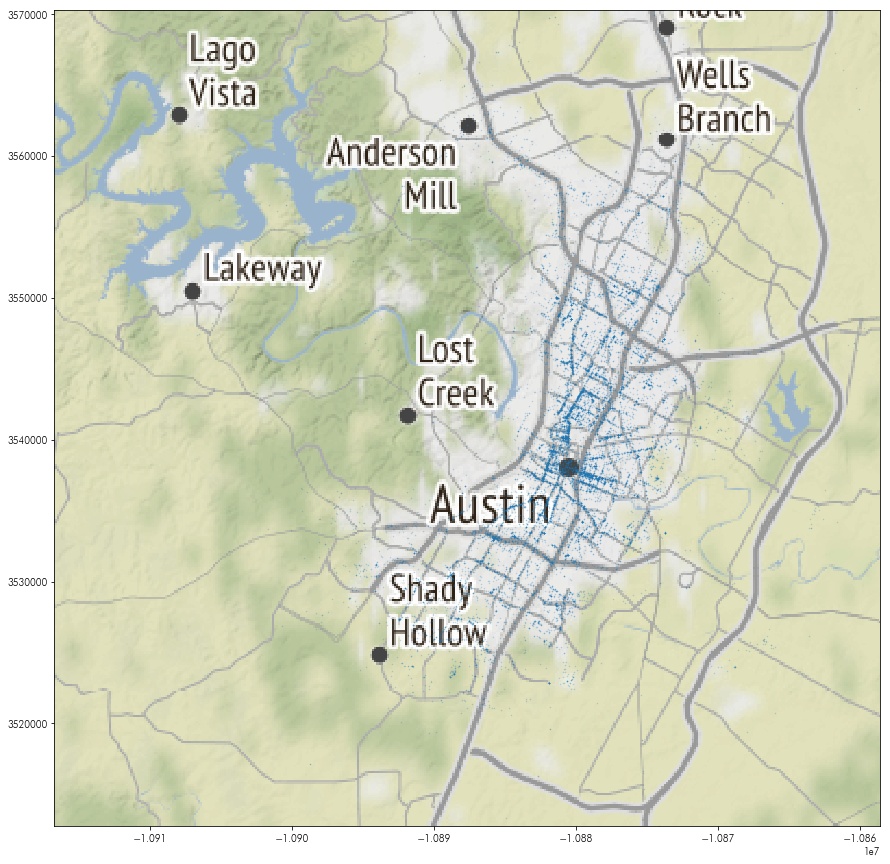
How many incidents with the Public Health department are within each neighborhood?
reports.department.unique()
health = reports.query('department == "Public Health" '
              'or department == "Health & Human Services"')
plt.figure(figsize=(15,15))
plt.imshow(basemap, extent=basemap_extent)
health.plot(ax=plt.gca(), marker='.', markersize=1, alpha=.25)
plt.axis(health.total_bounds[[0,2,1,3]])
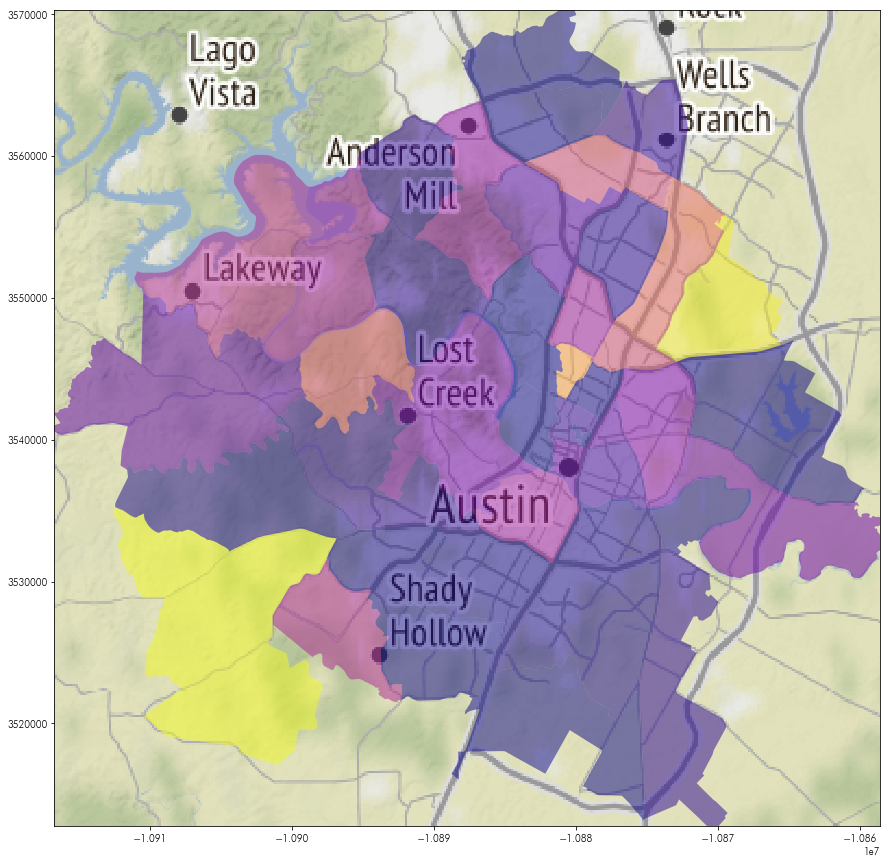
neighborhoods = neighborhoods.to_crs(epsg=3857)
hood_counts = geopandas.sjoin(neighborhoods, health, op='contains')\
                       .groupby('hood_id').index_right.count()
neighborhoods['health_incidents'] = hood_counts.values
plt.figure(figsize=(15,15))
plt.imshow(basemap, extent=basemap_extent)
neighborhoods.plot('health_incidents', ax=plt.gca(),
                   cmap='plasma', alpha=.5)
plt.axis(health.total_bounds[[0,2,1,3]])
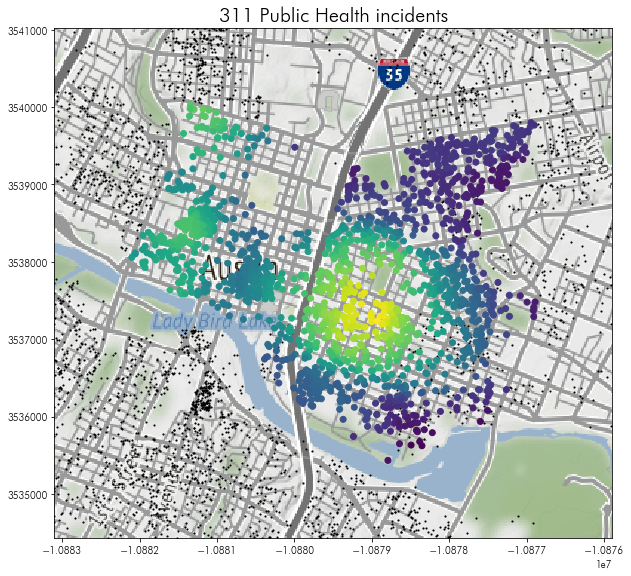
How many public health events are within 1km of each airbnb downtown?
listings = geopandas.read_file('../data/listings.gpkg')
listings = listings.to_crs(epsg=3857)
downtown_hoods = ('Downtown', 'East Downtown')
downtown_listings = listings.query('hood in @downtown_hoods').sort_values('id')
downtown_listings['buffer'] = downtown_listings.buffer(1000)
within_each_buffer = geopandas.sjoin(downtown_listings.set_geometry('buffer'),
                                     health, op='contains')
event_counts = within_each_buffer.groupby('id').request_number.count()
downtown_listings['event_counts'] = event_counts.values
downtown_listings.sort_values('event_counts', ascending=False).head(5)[['id', 'name', 'event_counts']]
downtownmap, downtownmap_extent = contextily.bounds2img(*downtown_listings.buffer(1000).total_bounds,
                                                        zoom=13, ll=False)
plt.figure(figsize=(10,10))
plt.imshow(downtownmap, extent=downtownmap_extent)
listings.plot(color='k', marker='.', markersize=5, ax=plt.gca())
downtown_listings.plot('event_counts', ax=plt.gca())
plt.axis(downtown_listings.buffer(1000).total_bounds[[0,2,1,3]], markersize=5)
plt.title('311 Public Health incidents', fontsize=20)
What’s the event type that is closest to each airbnb in Austin?
from pysal.lib.weights.distance import get_points_array
from scipy.spatial import cKDTree
report_coordinates = get_points_array(reports.geometry)
airbnb_coordinates = get_points_array(listings.geometry)
report_kdt = cKDTree(report_coordinates)
distances, indices = report_kdt.query(airbnb_coordinates, k=2)
listings['nearest_type'] = reports.iloc[indices[:,1]]['description'].values
listings.groupby('nearest_type').id.count().sort_values(ascending=False).head(20)