Generating h3 Hexgrids from GeoDataFrames
[1]:
import geopandas as gpd
import libpysal
import matplotlib.pyplot as plt
import pandas

from tobler.area_weighted import area_interpolate
from tobler.util import h3fy

%load_ext watermark
%watermark -v -a "author: eli knaap" -d -u -p tobler,cenpy,geopandas
Author: author: eli knaap

Last updated: 2021-01-18

Python implementation: CPython
Python version       : 3.8.6
IPython version      : 7.19.0

tobler   : 0.5.4
cenpy    : 1.0.0.post4
geopandas: 0.8.1
Note: This notebook relies on functionality from the `contextily <https://contextily.readthedocs.io/en/latest/>`__ package that provides convenient basemaps for geospatial plots, and the `cenpy <https://cenpy-devs.github.io/cenpy/>`__ package that provide a convenient interface to the U.S. Census API. These can be installed with
pip install contextily cenpyconda install contextily cenpy -c conda-forge[2]:
import contextily as ctx
from cenpy import products
Getting data from CenPy
To begin with, we will fetch some data from the 2017 ACS
[3]:
acs = products.ACS(2017)
We’re looking for median home value, so first we will filter the ACS tables by those containing “value” in the description so we can find the correct variable code
[4]:
acs.filter_tables("VALUE", by="description")
[4]:
| description | columns | |
|---|---|---|
| table_name | ||
| B25075 | VALUE | [B25075_001E, B25075_002E, B25075_003E, B25075... |
| B25076 | LOWER VALUE QUARTILE (DOLLARS) | [B25076_001E] |
| B25077 | MEDIAN VALUE (DOLLARS) | [B25077_001E] |
| B25078 | UPPER VALUE QUARTILE (DOLLARS) | [B25078_001E] |
| B25079 | AGGREGATE VALUE (DOLLARS) BY AGE OF HOUSEHOLDER | [B25079_001E, B25079_002E, B25079_003E, B25079... |
| B25080 | AGGREGATE VALUE (DOLLARS) BY UNITS IN STRUCTURE | [B25080_001E, B25080_002E, B25080_003E, B25080... |
| B25082 | AGGREGATE VALUE (DOLLARS) BY MORTGAGE STATUS | [B25082_001E, B25082_002E, B25082_003E] |
| B25083 | MEDIAN VALUE (DOLLARS) FOR MOBILE HOMES | [B25083_001E] |
| B25096 | MORTGAGE STATUS BY VALUE | [B25096_001E, B25096_002E, B25096_003E, B25096... |
| B25097 | MORTGAGE STATUS BY MEDIAN VALUE (DOLLARS) | [B25097_001E, B25097_002E, B25097_003E] |
| B25100 | MORTGAGE STATUS BY RATIO OF VALUE TO HOUSEHOLD... | [B25100_001E, B25100_002E, B25100_003E, B25100... |
| B25107 | MEDIAN VALUE BY YEAR STRUCTURE BUILT | [B25107_001E, B25107_002E, B25107_003E, B25107... |
| B25108 | AGGREGATE VALUE (DOLLARS) BY YEAR STRUCTURE BUILT | [B25108_001E, B25108_002E, B25108_003E, B25108... |
| B25109 | MEDIAN VALUE BY YEAR HOUSEHOLDER MOVED INTO UNIT | [B25109_001E, B25109_002E, B25109_003E, B25109... |
| B25110 | AGGREGATE VALUE (DOLLARS) BY YEAR HOUSEHOLDER ... | [B25110_001E, B25110_002E, B25110_003E, B25110... |
| B25121 | HOUSEHOLD INCOME IN THE PAST 12 MONTHS (IN 201... | [B25121_001E, B25121_002E, B25121_003E, B25121... |
| B992519 | ALLOCATION OF VALUE | [B992519_001E, B992519_002E, B992519_003E] |
The variable we’re looking for is B25077_001E, the median home value of each. Lets collect that data for the Washington DC metropolitan region. The next cell can take a minute or two to run, depending on the speed of your connection.
[5]:
dc = acs.from_msa("Washington-Arlington", variables=["B25077_001E"])
/Users/knaaptime/anaconda3/envs/tobler/lib/python3.8/site-packages/pyproj/crs/crs.py:53: FutureWarning: '+init=<authority>:<code>' syntax is deprecated. '<authority>:<code>' is the preferred initialization method. When making the change, be mindful of axis order changes: https://pyproj4.github.io/pyproj/stable/gotchas.html#axis-order-changes-in-proj-6
  return _prepare_from_string(" ".join(pjargs))
[6]:
dc.head()
[6]:
| GEOID | geometry | B25077_001E | NAME | state | county | tract | |
|---|---|---|---|---|---|---|---|
| 0 | 51047930501 | POLYGON ((-8697543.430 4642311.970, -8697525.0... | 277000.0 | Census Tract 9305.01, Culpeper County, Virginia | 51 | 047 | 930501 |
| 1 | 51043010100 | POLYGON ((-8692606.860 4745175.960, -8692597.2... | 319600.0 | Census Tract 101, Clarke County, Virginia | 51 | 043 | 010100 |
| 2 | 51107610701 | POLYGON ((-8656718.120 4739943.880, -8656659.1... | 461500.0 | Census Tract 6107.01, Loudoun County, Virginia | 51 | 107 | 610701 |
| 3 | 51177020408 | POLYGON ((-8654861.430 4622579.010, -8654714.2... | 241500.0 | Census Tract 204.08, Spotsylvania County, Virg... | 51 | 177 | 020408 |
| 4 | 51061930402 | POLYGON ((-8657404.180 4678713.200, -8657386.4... | 402000.0 | Census Tract 9304.02, Fauquier County, Virginia | 51 | 061 | 930402 |
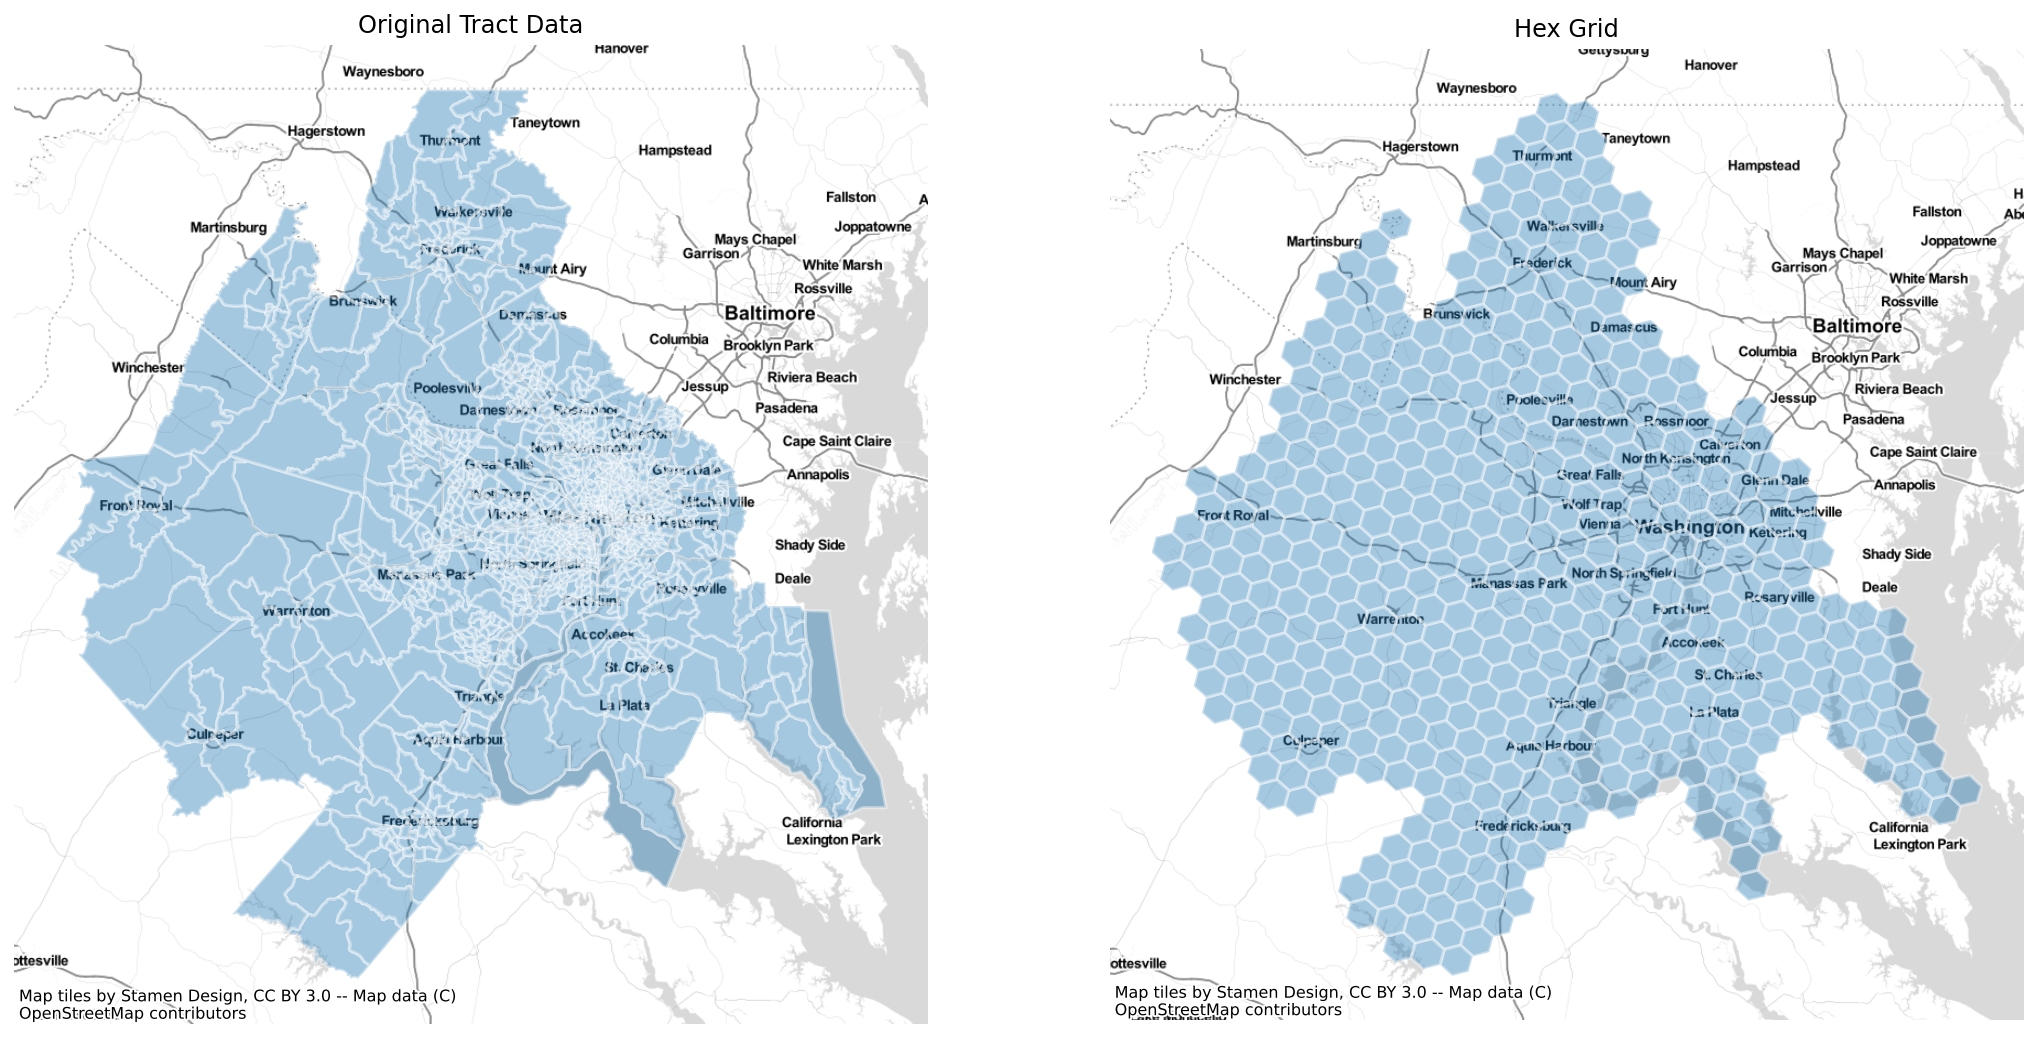
Creating Hexgrids with the h3fy function
Using the h3fy function from the tobler.util module, we can easily generate a hexgrid covering the face of the DC Metropolitan region
[7]:
dc_hex = h3fy(dc)
[8]:
fig, axs = plt.subplots(1, 2, figsize=(18, 10))
axs = axs.flatten()

dc.plot(ax=axs[0], alpha=0.4, linewidth=1.6, edgecolor="white")
dc_hex.plot(ax=axs[1], alpha=0.4, linewidth=1.6, edgecolor="white")

axs[0].set_title("Original Tract Data")
axs[1].set_title("Hex Grid")

for i, _ in enumerate(axs):
    ctx.add_basemap(axs[i], source=ctx.providers.Stamen.TonerLite)
    axs[i].axis("off")
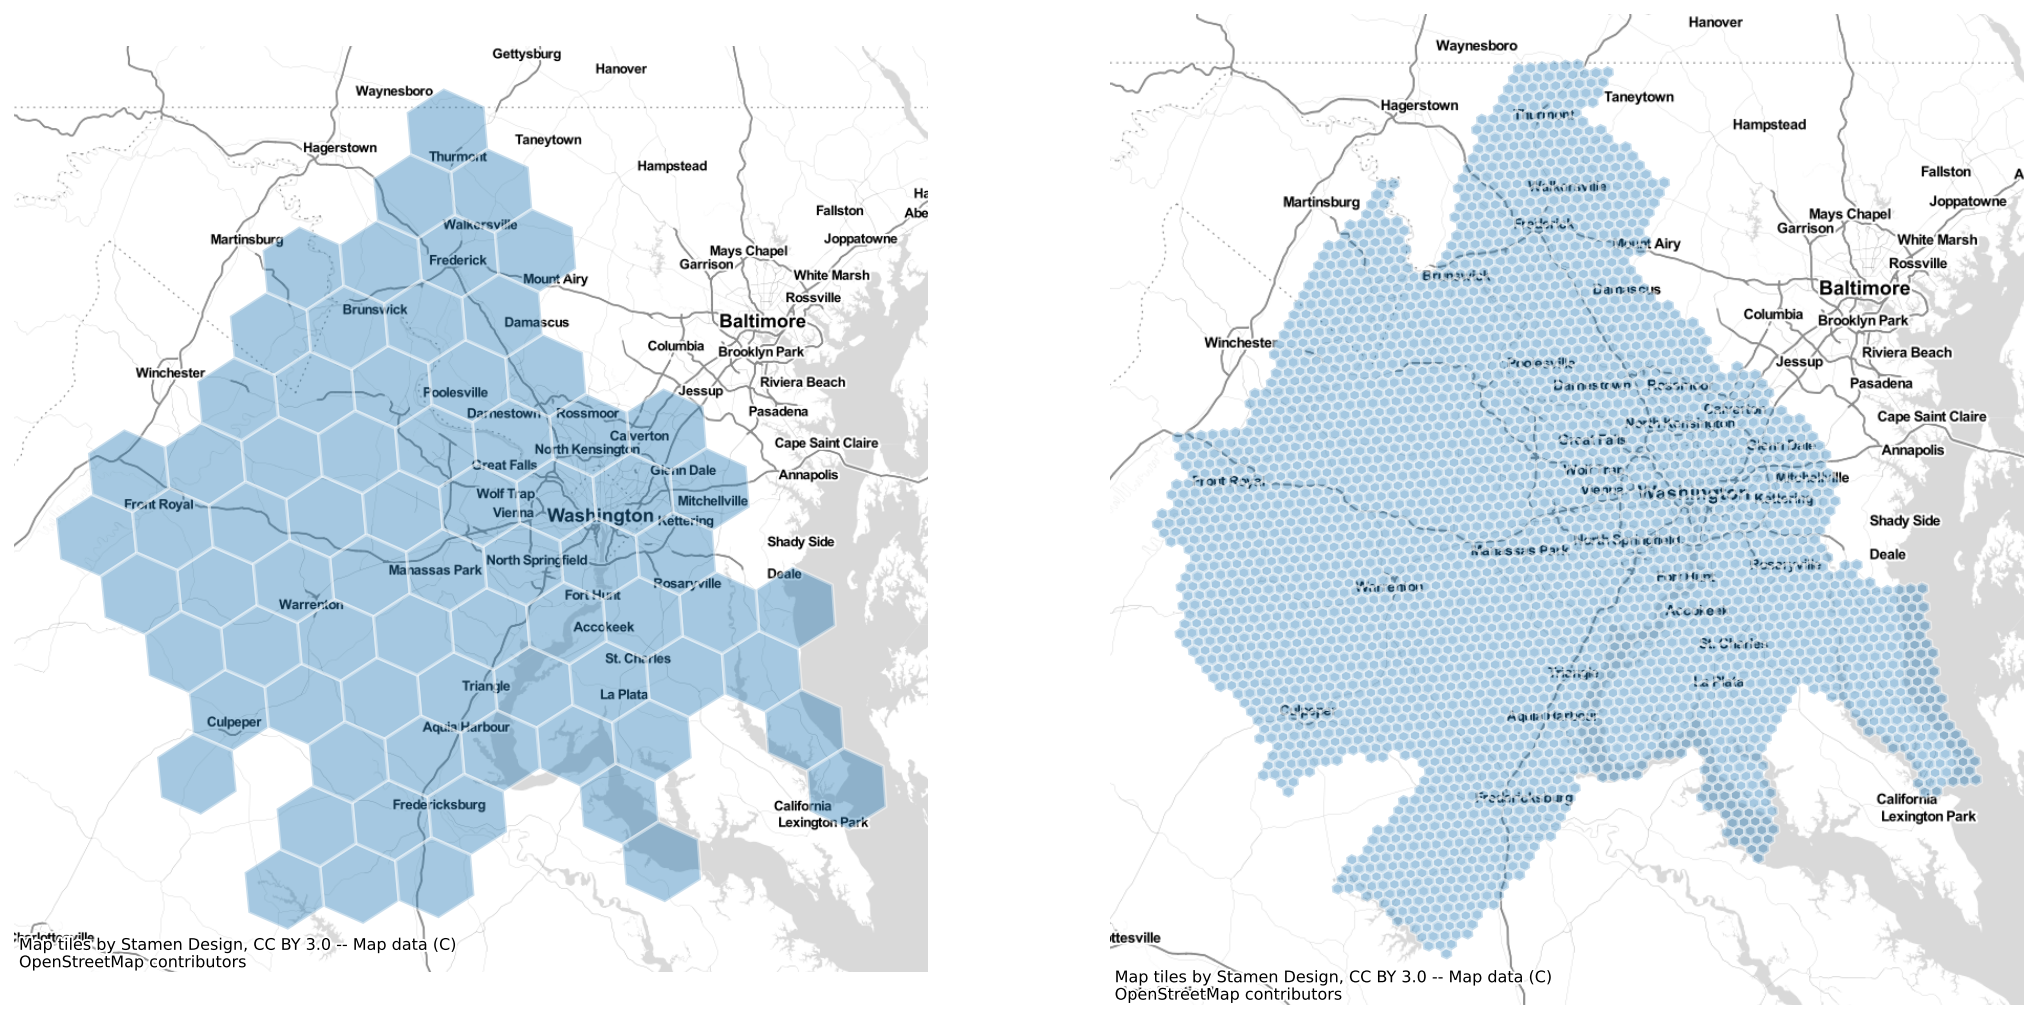
By altering the resolution parameter, we can generate grids using hexes of various sizes
[9]:
dc_hex_large = h3fy(dc, resolution=5)
dc_hex_small = h3fy(dc, resolution=7)
[10]:
fig, axs = plt.subplots(1, 2, figsize=(18, 10))

dc_hex_large.plot(ax=axs[0], alpha=0.4, linewidth=1.6, edgecolor="white")
dc_hex_small.plot(ax=axs[1], alpha=0.4, linewidth=1.6, edgecolor="white")

for ax in axs:
    ctx.add_basemap(ax=ax, source=ctx.providers.Stamen.TonerLite)
    ax.axis("off")
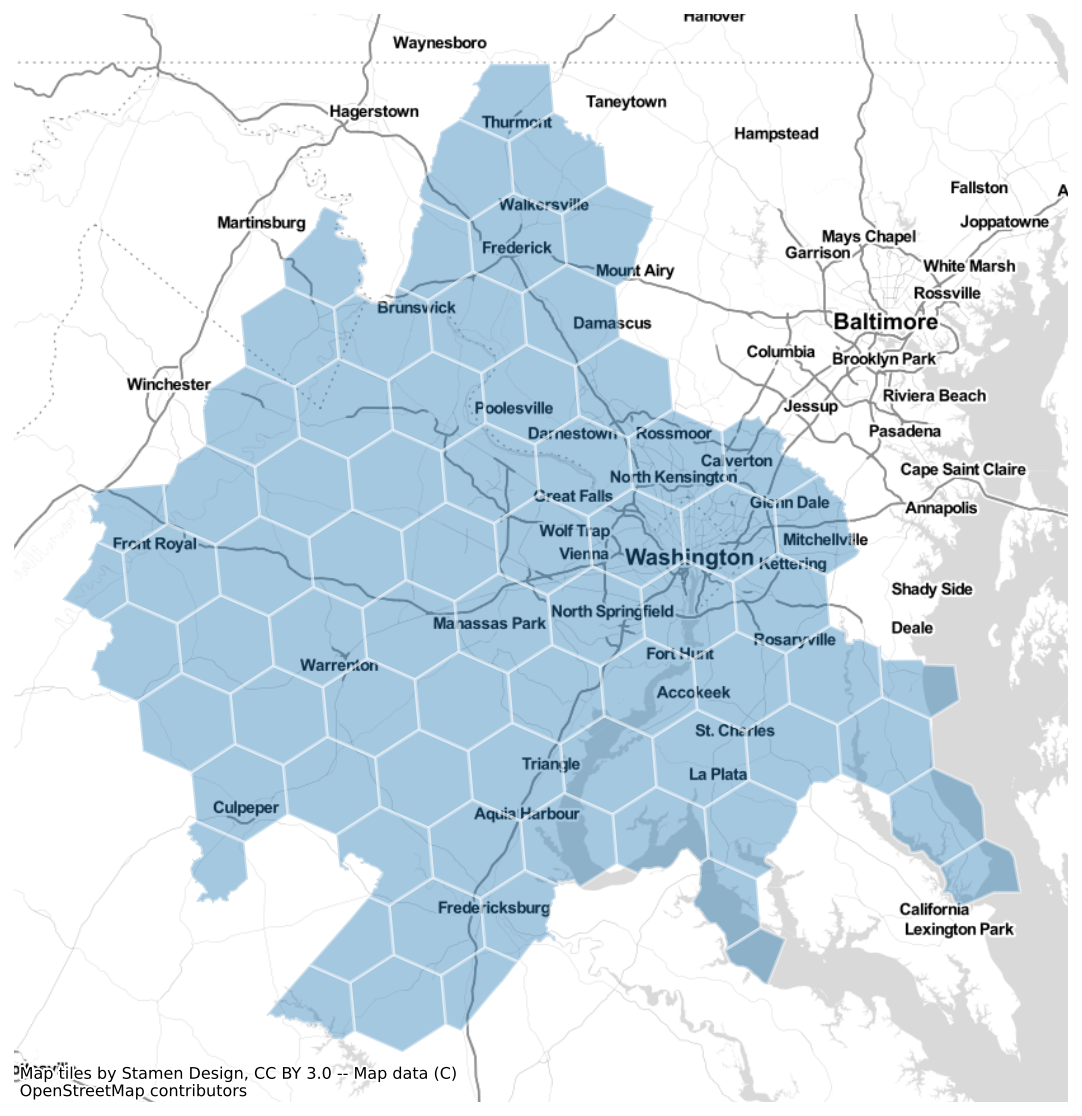
and by using the clip parameter, we can ensure that the hexgrid is does not extend beyond the borders of the input geodataframe
[11]:
dc_hex_clipped = h3fy(dc, resolution=5, clip=True)
[12]:
fig, ax = plt.subplots(figsize=(10, 10))

dc_hex_clipped.plot(ax=ax, alpha=0.4, linewidth=1.6, edgecolor="white")
ctx.add_basemap(ax=ax, source=ctx.providers.Stamen.TonerLite)
ax.axis("off")
[12]:
(-8738395.66, -8484578.799999999, 4575391.257202434, 4837245.453466552)
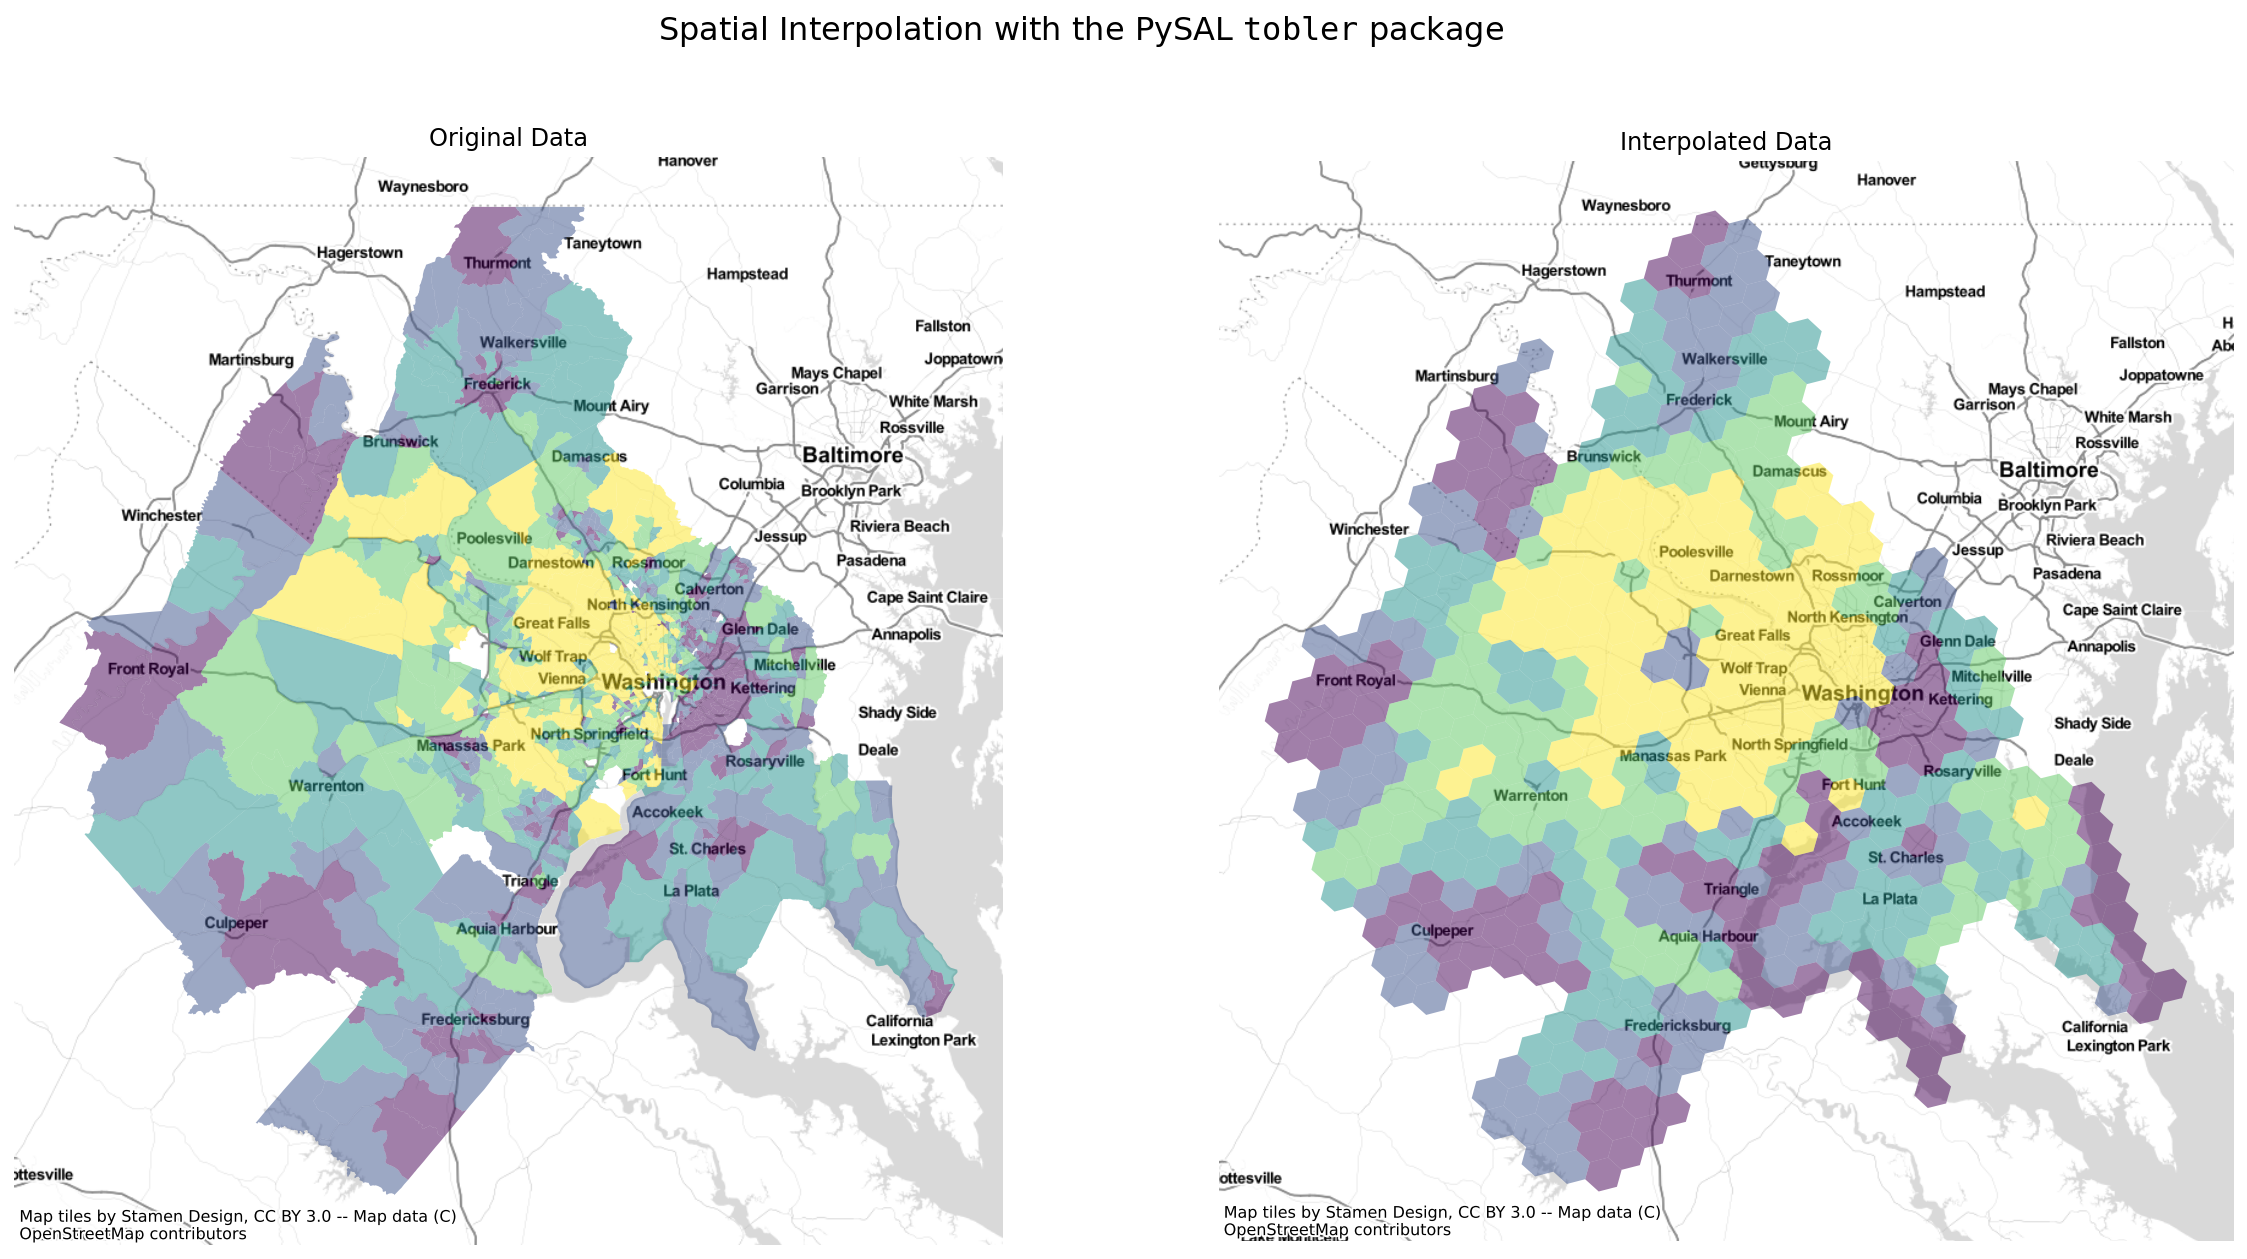
Interpolating to a hexgrid
Thus, in just a few lines of code, we can estimate the value of census variables represented by a regular hexgrid
here, we will estimate the median home value of each hex in the DC region using simple areal interpolation
[13]:
dc_hex_interpolated = area_interpolate(
    source_df=dc, target_df=dc_hex, intensive_variables=["B25077_001E"]
)
/Users/knaaptime/Dropbox/projects/tobler/tobler/util/util.py:32: UserWarning: nan values in variable: B25077_001E, replacing with 0
  warn(f"nan values in variable: {column}, replacing with 0")
[14]:
fig, axs = plt.subplots(1, 2, figsize=(20, 10))
dc.plot("B25077_001E", scheme="quantiles", alpha=0.5, ax=axs[0])

dc_hex_interpolated.plot("B25077_001E", scheme="quantiles", alpha=0.5, ax=axs[1])

axs[0].set_title("Original Data")
axs[1].set_title("Interpolated Data")

for ax in axs:
    ctx.add_basemap(ax=ax, source=ctx.providers.Stamen.TonerLite)
    ax.axis("off")
plt.suptitle(
    r"Spatial Interpolation with the PySAL $\mathtt{tobler}$ package", fontsize=16
)
[14]:
Text(0.5, 0.98, 'Spatial Interpolation with the PySAL $\\mathtt{tobler}$ package')