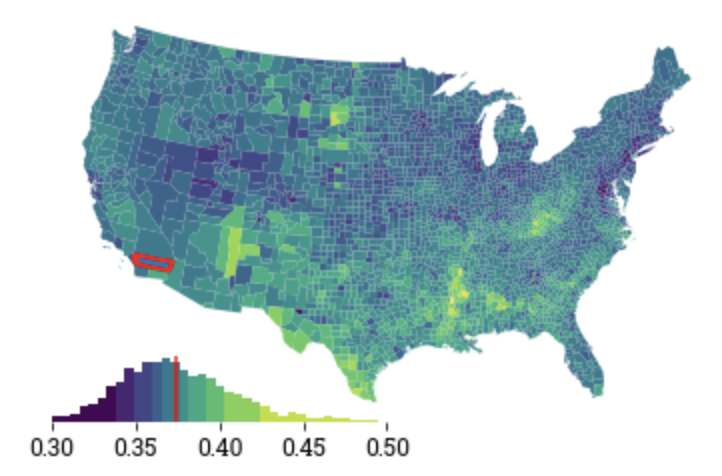
Legendgram is a small package that provides legendgrams legends that visualize the distribution of observations by color in a given map. These distributional visualizations for map classification schemes assist in analytical cartography and spatial data visualization.
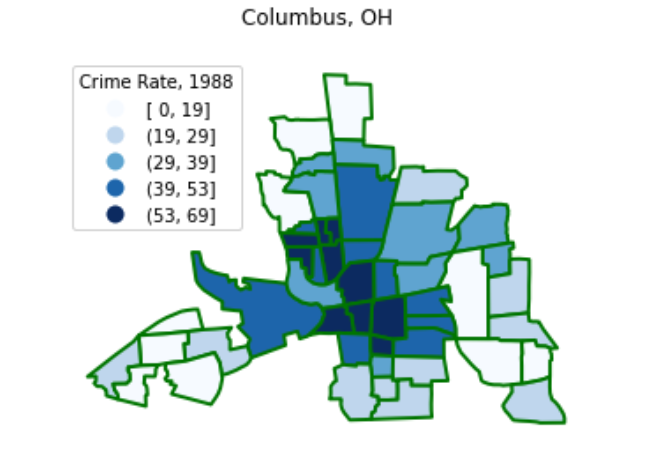
Mapclassify provides functionality for Choropleth map classification. Currently, fifteen different classification schemes are available, including a highly-optimized implementation of Fisher-Jenks optimal classification. Each scheme inherits a common structure that ensures computations are scalable and supports applications in streaming contexts.
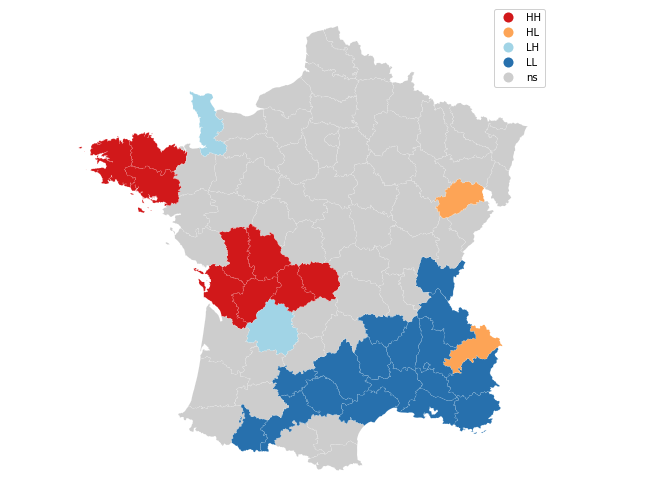
Splot provides statistical visualizations for spatial analysis. It methods for visualizing global and local spatial autocorrelation (through Moran scatterplots and cluster maps), temporal analysis of cluster dynamics (through heatmaps and rose diagrams), and multivariate choropleth mapping (through value-by-alpha maps. A high level API supports the creation of publication-ready visualizations.