This page was generated from notebooks/voronoi.ipynb.
Interactive online version:
![]()
Voronoi Polygons for 2-D Point Sets
Author: Serge Rey (http://github.com/sjsrey)
Basic Usage
[24]:
import sys
import os
sys.path.append(os.path.abspath('..'))
import libpysal
[25]:
from libpysal.cg.voronoi import voronoi, voronoi_frames
[26]:
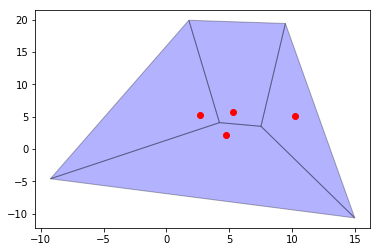
points = [(10.2, 5.1), (4.7, 2.2), (5.3, 5.7), (2.7, 5.3)]
[27]:
regions, vertices = voronoi(points)
[28]:
regions
[28]:
[[1, 3, 2], [4, 5, 1, 0], [0, 1, 7, 6], [9, 0, 8]]
[29]:
vertices
[29]:
array([[  4.21783296,   4.08408578],
       [  7.51956025,   3.51807539],
       [  9.4642193 ,  19.3994576 ],
       [ 14.98210684, -10.63503022],
       [ -9.22691341,  -4.58994414],
       [ 14.98210684, -10.63503022],
       [  1.78491801,  19.89803294],
       [  9.4642193 ,  19.3994576 ],
       [  1.78491801,  19.89803294],
       [ -9.22691341,  -4.58994414]])
[30]:
region_df, point_df = voronoi_frames(points)
[31]:
%matplotlib inline
import matplotlib
import numpy as np
import matplotlib.pyplot as plt
[32]:
fig, ax = plt.subplots()
region_df.plot(ax=ax, color='blue',edgecolor='black', alpha=0.3)
point_df.plot(ax=ax, color='red')
[32]:
<matplotlib.axes._subplots.AxesSubplot at 0x7f85e38b94a8>
Larger Problem
[33]:
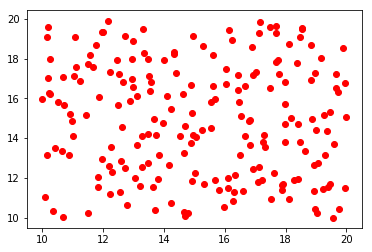
n_points = 200
np.random.seed(12345)
points = np.random.random((n_points,2))*10 + 10
results = voronoi(points)
mins = points.min(axis=0)
maxs = points.max(axis=0)
[34]:
regions, vertices = voronoi(points)
[35]:
regions_df, points_df = voronoi_frames(points)
[36]:
fig, ax = plt.subplots()
points_df.plot(ax=ax, color='red')
[36]:
<matplotlib.axes._subplots.AxesSubplot at 0x7f85e39dae10>
[37]:
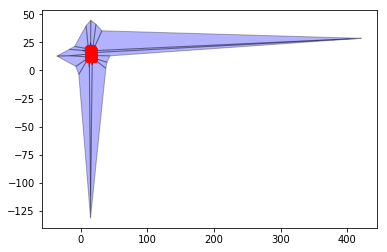
fig, ax = plt.subplots()
regions_df.plot(ax=ax, color='blue',edgecolor='black', alpha=0.3)
points_df.plot(ax=ax, color='red')
[37]:
<matplotlib.axes._subplots.AxesSubplot at 0x7f85e1fbd240>
Trimming
[38]:
points = np.array(points)
maxs = points.max(axis=0)
mins = points.min(axis=0)
xr = maxs[0] - mins[0]
yr = maxs[1] - mins[1]
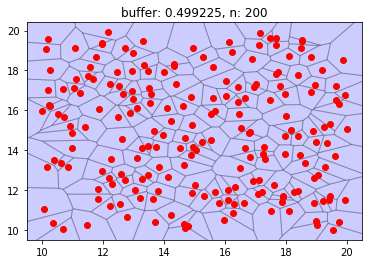
buff = 0.05
r = max(yr, xr) * buff
minx = mins[0] - r
miny = mins[1] - r
maxx = maxs[0] + r
maxy = maxs[1] + r
[39]:
fig, ax = plt.subplots()
regions_df.plot(ax=ax, edgecolor='black', facecolor='blue', alpha=0.2 )
points_df.plot(ax=ax, color='red')
plt.xlim(minx, maxx)
plt.ylim(miny, maxy)
plt.title("buffer: %f, n: %d"%(r,n_points))
plt.show()
Voronoi Weights
[40]:
from libpysal.weights.contiguity import Voronoi as Vornoi_weights
[41]:
w = Vornoi_weights(points)
[42]:
w.n
[42]:
200
[43]:
w.pct_nonzero
[43]:
2.915
[44]:
w.histogram
[44]:
[(3, 3),
 (4, 28),
 (5, 52),
 (6, 65),
 (7, 34),
 (8, 10),
 (9, 5),
 (10, 2),
 (11, 0),
 (12, 1)]
[45]:
idx = [i for i in range(w.n) if w.cardinalities[i]==12]
[46]:
points[idx]
[46]:
array([[16.50851787, 13.12932895]])
[ ]: